Deploy in minutes with 100+ ready-to-use integrations
ilert seamlessly connects with your tools using out pre-built integrations or via email. ilert integrates with monitoring, ticketing, chat, and collaboration tools.
See how industry leaders achieve 99.9% uptime with ilert
Organizations worldwide trust ilert to streamline incident management, enhance reliability, and minimize downtime. Read what our customers have to say about their experience with our platform.
The ilert mobile app is primarily used by responders to receive notifications about critical alerts, react to them on the go, and check their current on-call status. It has various capabilities, including critical notifications via push, quick actions for alerts, and critical alert settings. The app enables responders to view their current on-call shifts and escalation policies, take on-call shifts from somebody else, and create coverage requests to ask for on-call shift handover from a colleague. The latter is a new feature of ilert that has proven to be very useful for a communication tool between users, and this post is taking a deeper dive into the development of the feature and the challenges we faced developing it.
Why were coverage requests introduced?
Since we introduced on-call schedules, users have been able to create overrides—special shifts that take priority over regular ones. An override lets you assign another user to take over on-call duty, either for a full shift or just part of it. Overrides don’t have to follow existing shifts—they can be created for any time period, even outside of configured shifts.
Later on, the "Take on-call" feature was introduced, which is the opposite of overriding my shifts. Both methods create overrides, but neither method ensures that the other user gets notified of any action taken on their on-call shifts. Furthermore, creating overrides for other users was giving them responsibility they eventually weren't aware of, and this could be critical.
The solution for this problem was to introduce a flow of asking another user to take over specific on-call duties, resulting in a short communication stream of requesting coverage.
Designing the coverage request REST API
The general flow of a coverage request should be:
1. User A creates a coverage request, asking User B to (partially) take over one or multiple shifts
2. User B gets notified, either accepts or declines the coverage request
3. User A gets notified of the action that User B decided to choose
We needed to design the API around a coverage request entity, which had to have at least the following fields:
- sender
- receiver
- shifts
Additionally, we added a message field to give users an option to communicate additional details for their request. For the user interface, we also provided the current state and the createdAt date string, which are read-only properties. When the user declines the coverage request, some communication back may be useful too, handled by giving the user the ability to add a declineComment. Lastly, to show multiple coverage requests in a list view and apply meaningful filters, we used the state field in combination with an `expired` state calculated in the frontend. A coverage request is considered expired when the last shift it covers has ended.
Beyond the classic Create and Read operations on the coverage request entity, we needed specific endpoints to perform actions: accept, decline, and cancel. Update and Delete operations are not part of the flow right now and won't be implemented.
From mockup to polished UI
There are no significant differences between the mockup and the final version of the coverage request creation view. The styles have been adjusted, and an additional timezone information box has been included. The final versions of the list view and the detail view look like this:
Communication is key
A general goal of this feature is to motivate users to see and respond to coverage requests as early as possible, as on-call shifts are always bound to time and can sometimes be on short notice. Another goal is to let all relevant communication stay in the ilert mobile app, eliminating the need to switch between tools. To achieve this, several means of communication are introduced.
Push notifications
Whenever an action related to a coverage request is taken, a push notification is sent to the relevant person.
But what if the receiver doesn't have a mobile app?
Email
ilert checks if any of the relevant users don't have at least one registered push notification token (unique ID from a user on a device, used by ilert to route push notifications). If that is the case, ilert sends out an email to the user’s primary email, containing information about the coverage request.
In-app badge
Sometimes push notifications get dismissed by accident, without recognising the content (and possibly swiping away a time-critical coverage request). To provide more presence in the app, a small red circle (badge) is added at the top left of the menu icon in each list view. It indicates whether there is one or more pending coverage requests for review. Additionally, the main menu item shows a count of all pending requests at any time.
Provide filters, but keep the UI clean
Giving the user the ability to filter coverage requests in the list view is necessary. An obvious one is a filter for Received and Sent requests. Another important but tricky filter is for relevant requests only. That means any expired and not pending requests are filtered out by default. But as we already have the Received/Sent toggle, another toggle for Current/All would've cluttered the UI too much.
One idea was to introduce a filter toolbar (similar to the one implemented on the alert list), but the idea was discarded as it would've been the only filter at the time of release (which would've looked odd). Another idea was to choose the default: only show requests in state Pending, and let the user access all via a button click. Ultimately, we settled on this solution for its simplicity and ease of use.
Every day usage reveals papercuts
After the release of the feature, the ilert team started using the feature internally as well, and quickly recognized one flaw of the feature. When acting on a coverage request (accept, decline, or cancel), the coverage request would instantly disappear from the list without giving a clear confirmation of the coverage request's change of state.
Two improvements were put in place:
Stay on the detail view after an action happens to see the updated state of the request
Keep relevant coverage requests in the list view for 24 more hours after performing an action
The latter wasn't the case before, because the list was initially built upon the state field, meaning it would instantly disappear from the list upon acceptance. A click on past requests was needed to view the just-accepted request. Therefore, an additional query parameter was defined and included in the API, enabling the frontend to specify a past creation date. The response also included all coverage requests—no matter their status—from the given creation date up to now. Now users can see all pending coverage requests, plus recently accepted/declined/cancelled ones (in the last 24 hours).
Haven't installed the ilert app yet? Give it a try! Download the app for Android or iOS.
We’re excited to share that Rollbar is now part of the ilert integration catalog! This new technical partnership allows software teams to detect application errors in real time with Rollbar and instantly respond using ilert’s powerful alerting and incident management features.
What is Rollbar?
Rollbar is a comprehensive, real-time error monitoring and debugging platform designed to help development teams detect, diagnose, and resolve issues faster—before they impact users. By providing deep visibility into application errors across the entire software lifecycle, Rollbar empowers teams to ship higher-quality code with greater confidence. With clients like CircleCI, Twilio, Babbel, and Salesforce, Rollbar is trusted by teams that prioritize reliability and seamless user experience.
At its core, Rollbar gives you deep visibility into your application’s health by capturing errors as they happen. Whether it's a backend exception or a frontend crash, Rollbar collects detailed metadata—including stack traces, request parameters, and user data—so developers can fix bugs quickly and confidently.
Key highlights of Rollbar:
Real-time monitoring: Instantly detect and visualize errors.
Intelligent grouping: Reduce noise using machine learning-based error clustering.
Comprehensive context: Investigate errors with full context, from local variables to affected users.
Enterprise-ready: Scales with your infrastructure and offers strong security and integrations.
How you can benefit from the Rollbar and ilert integration
With this new integration, Rollbar alerts can now trigger events in ilert automatically—enabling rapid, targeted incident response across your engineering and SRE teams.
Here’s how your team benefits:
Deploy with confidence: Get notified instantly when a new deployment introduces an error. You can roll back quickly or fix forward without waiting for user complaints.
Bridge the gap between Dev and Ops: SREs and developers can collaborate more efficiently, as ilert routes Rollbar alerts to the right on-call engineer using your preferred notification channels—phone, SMS, push, Microsoft Teams, and more.
Centralized approach for faster root cause analysis: ilert enables teams to receive alerts from various alert sources, which helps to expedite root cause analysis. ilert as a central dispatcher can correlate Rollbar alerts with alerts from other sources to help teams resolve incidents faster.
How to Connect Rollbar and ilert
Getting started is easy. To integrate Rollbar with ilert, follow our step-by-step guide. It takes just a few minutes to:
Create an alert source in ilert.
Generate an endpoint URL.
Add the webhook in your Rollbar settings.
Once connected, Rollbar will send error notifications to ilert, where you can manage them using your existing on-call schedules, escalation policies, and alerting preferences.
Checkmk launched Checkmk Cloud (SaaS) in February 2025, which is a fully managed, cloud-based version of their monitoring technology. This solution, designed for ease of use, allows enterprises to start monitoring their IT infrastructure with no installation, maintenance, or manual upgrades required. The SaaS version is compatible with both cloud-based and on-premises systems, bringing them together under a single, straightforward platform.
As Checkmk is one of the popular monitoring solutions chosen by ilert users, we decided to dive deep and test this new SAAS version to provide you with a helpful guide on connecting your Checkmk monitoring with the ilert incident management platform.
If you get stuck or anything is unclear, reach out to the ilert support team via the chat widget. We are happy to help!
What this guide covers
This step-by-step guide will help you:
Set up and configure Checkmk Cloud Monitoring for cloud-based and on-premises infrastructure
Create a dedicated IAM user in your AWS account with the necessary permissions to allow Checkmk to access and monitor your AWS resources.
Build an intuitive dashboard to monitor performance, detect anomalies, and gain real-time insights.
Receive critical Checkmk alerts via multiple channels, like SMS, phone calls, messengers, or push notifications with the help of ilert.
Prerequisites: What you will need to follow this guide
A registered account on Checkmk.
AWS Account with API Access.
IAM (Identity and Access Management) access.
A Checkmk Cloud instance deployed and accessible via a browser.
A Windows-running machine.
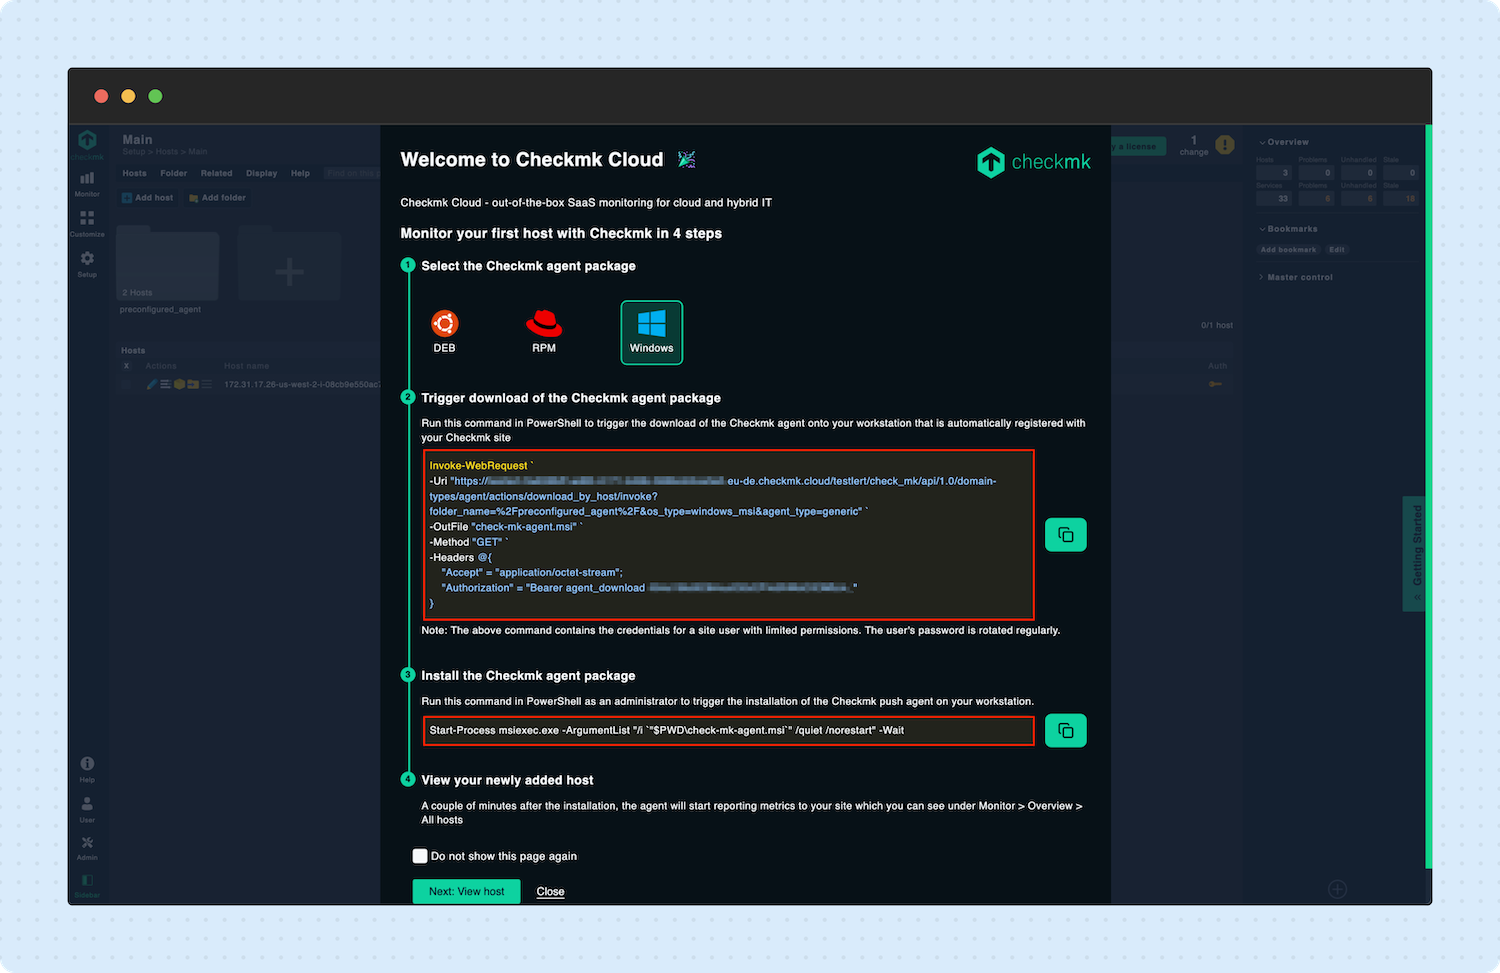
Stage 1: Adding a Windows host via Checkmk agent
Adding hosts is now more straightforward with Checkmk Cloud, which supports deploying monitoring agents directly on target systems. This approach reduces the need for manual configuration and shortens setup time, helping administrators scale their monitoring infrastructure more efficiently.
Select the Windows agent package.
Open Powershell on your Windows machine and follow the instructions.
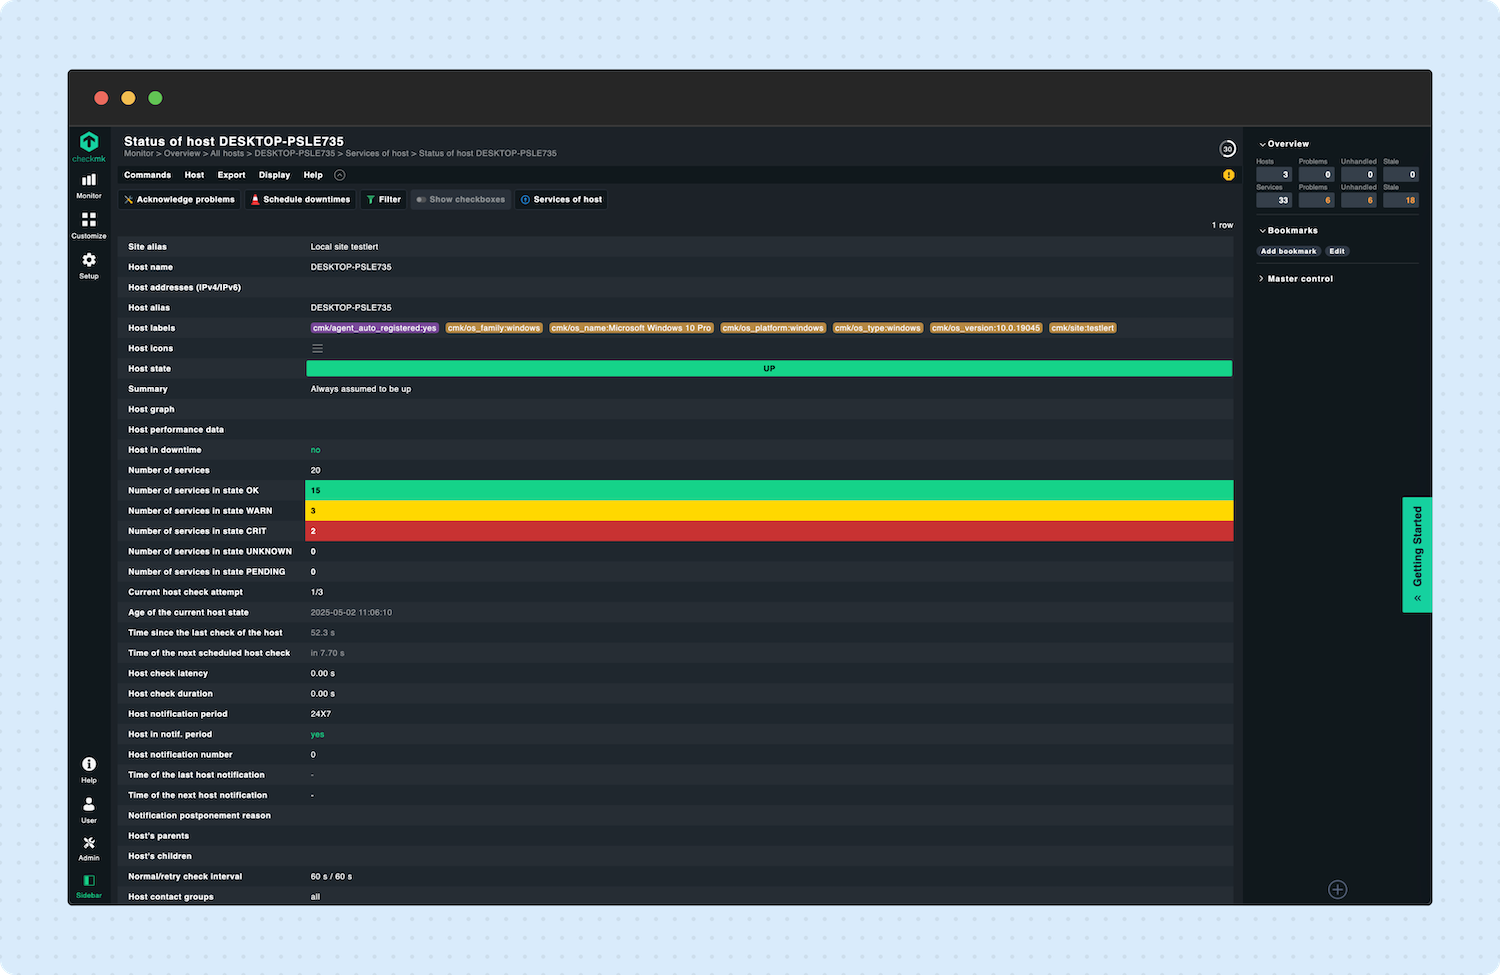
Navigate to the newly added host.
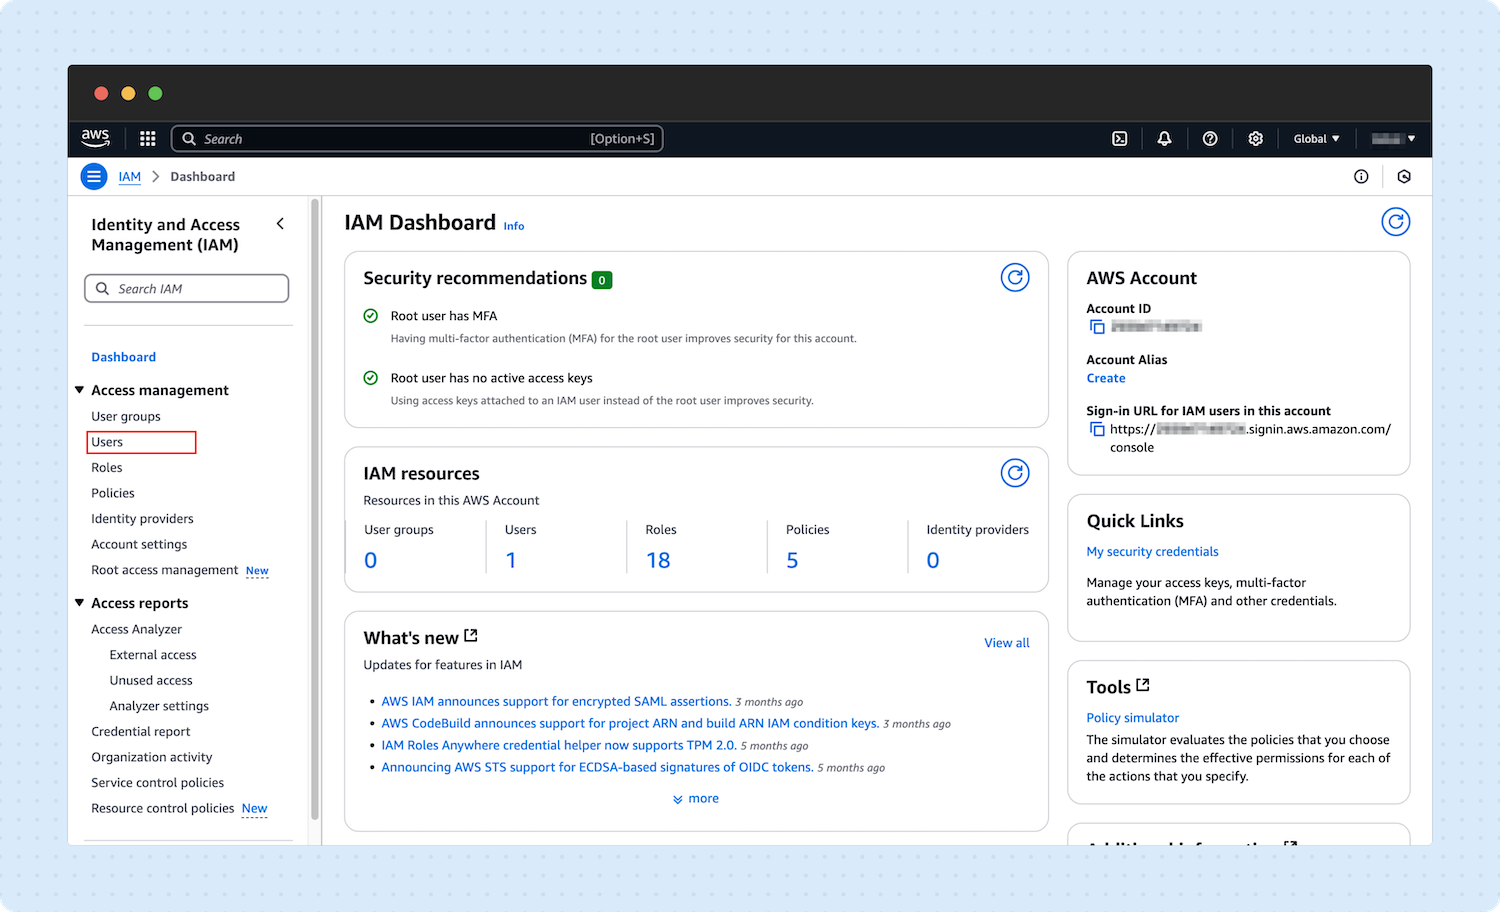
Stage 2: Creating an IAM User for Checkmk
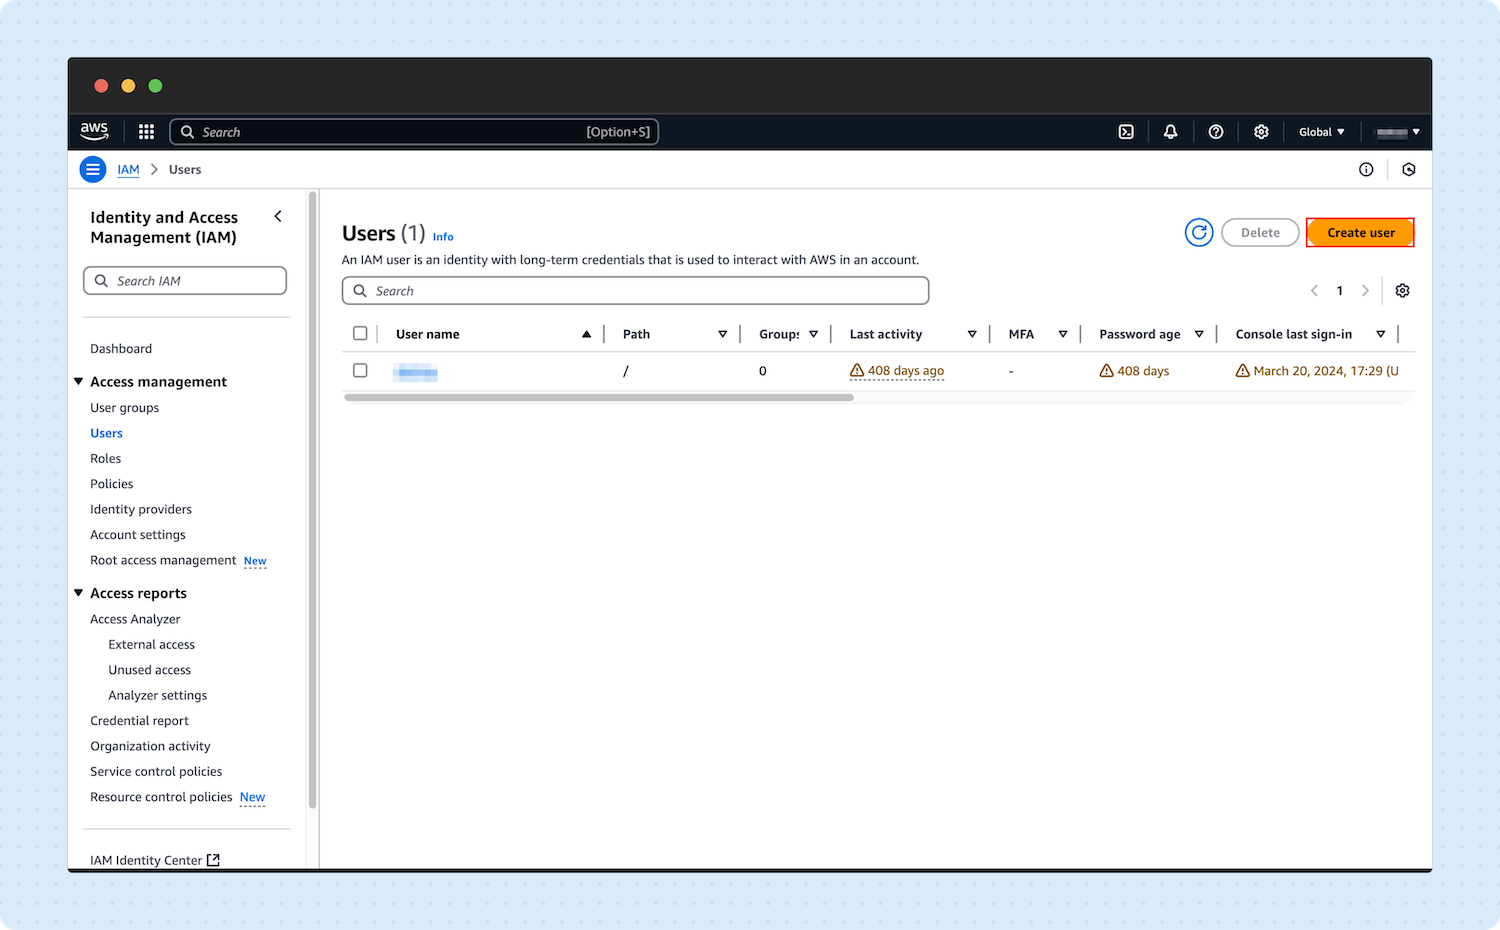
In AWS, open the IAM service and go to users.
In the top right corner, click “Create User.”
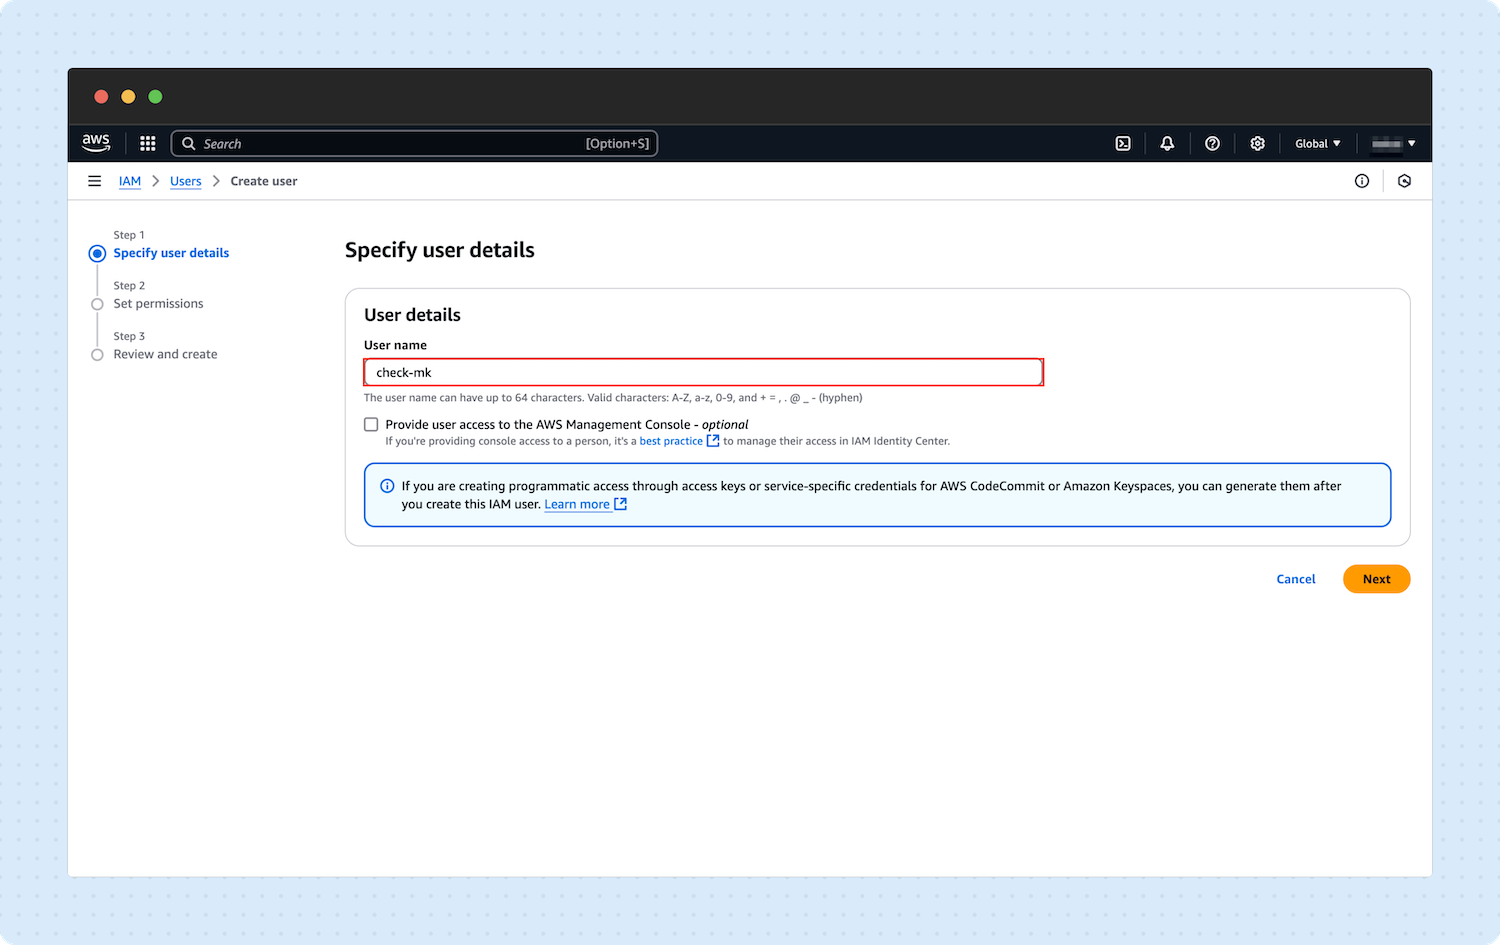
Enter a User name.
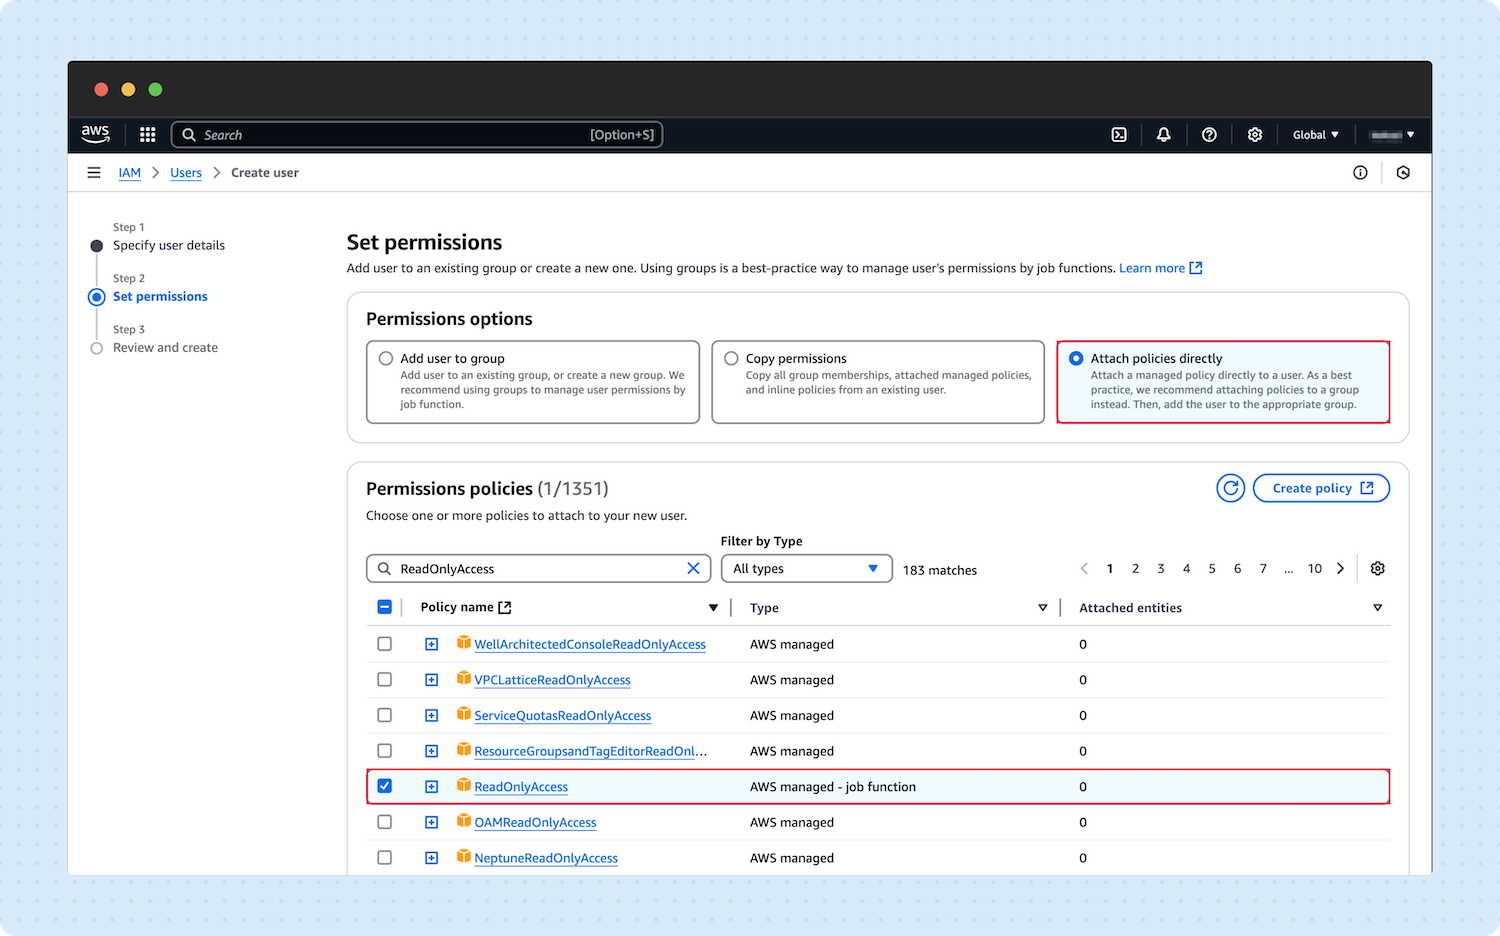
In the next step, click Attach policy directly and select the ReadOnlyAccess in the Permission policies.
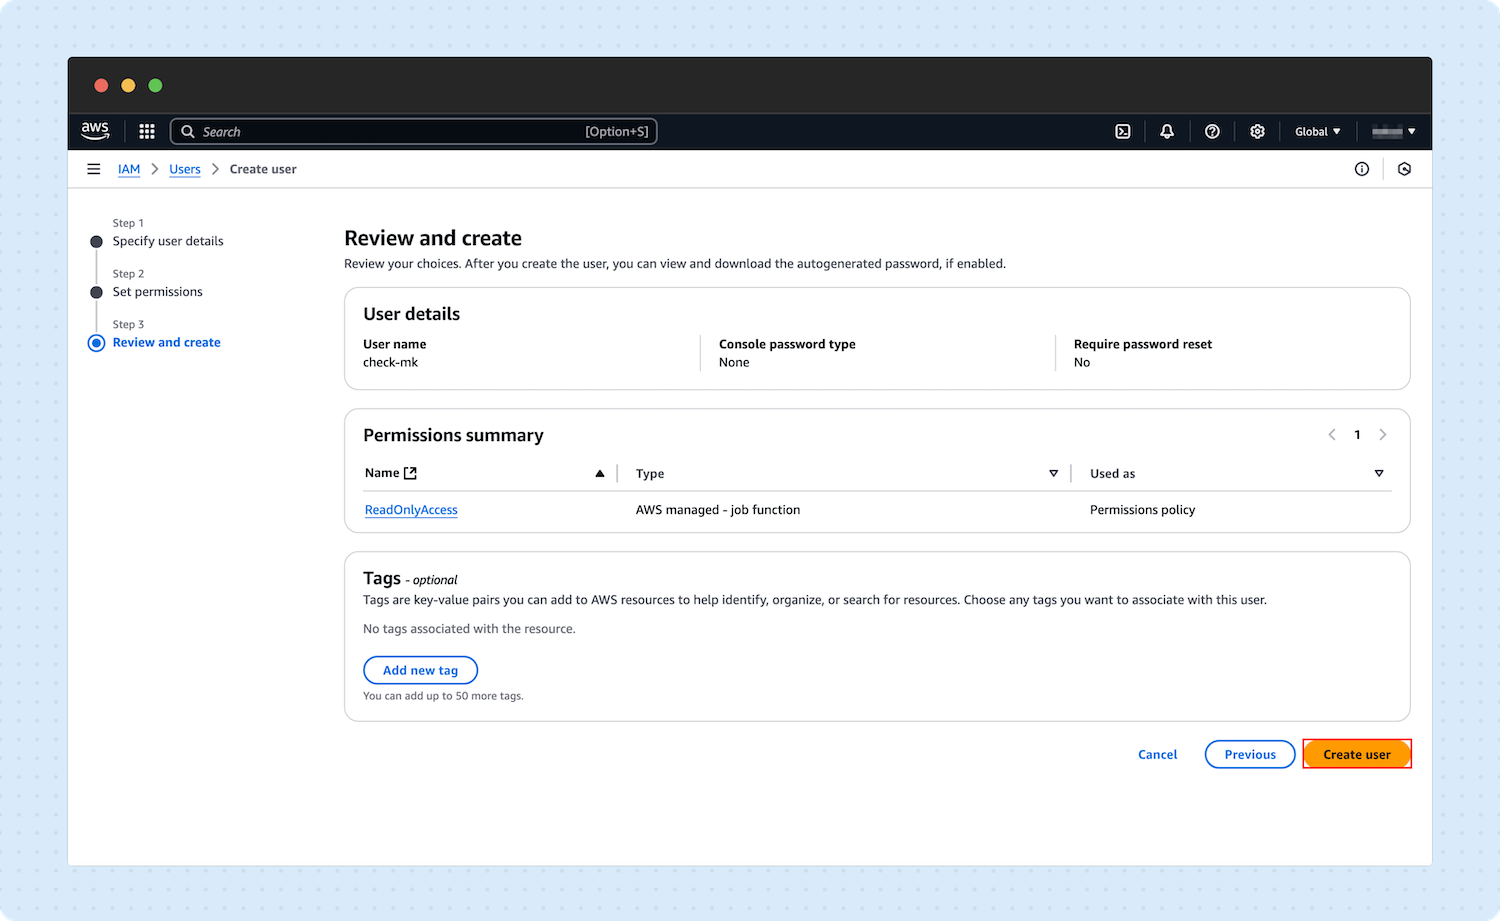
Click Create user.
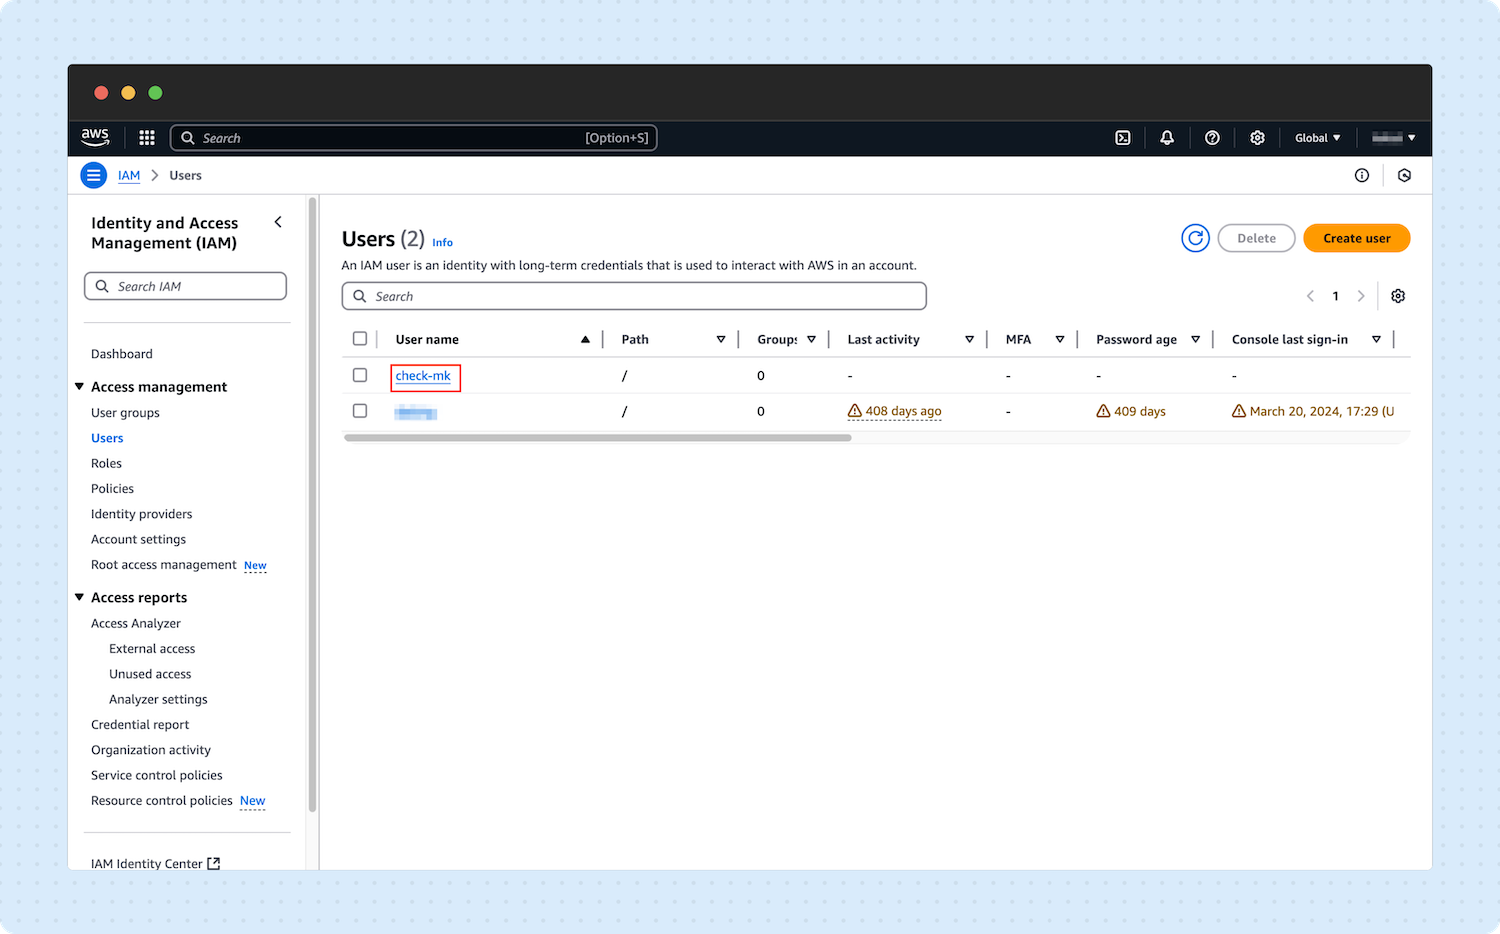
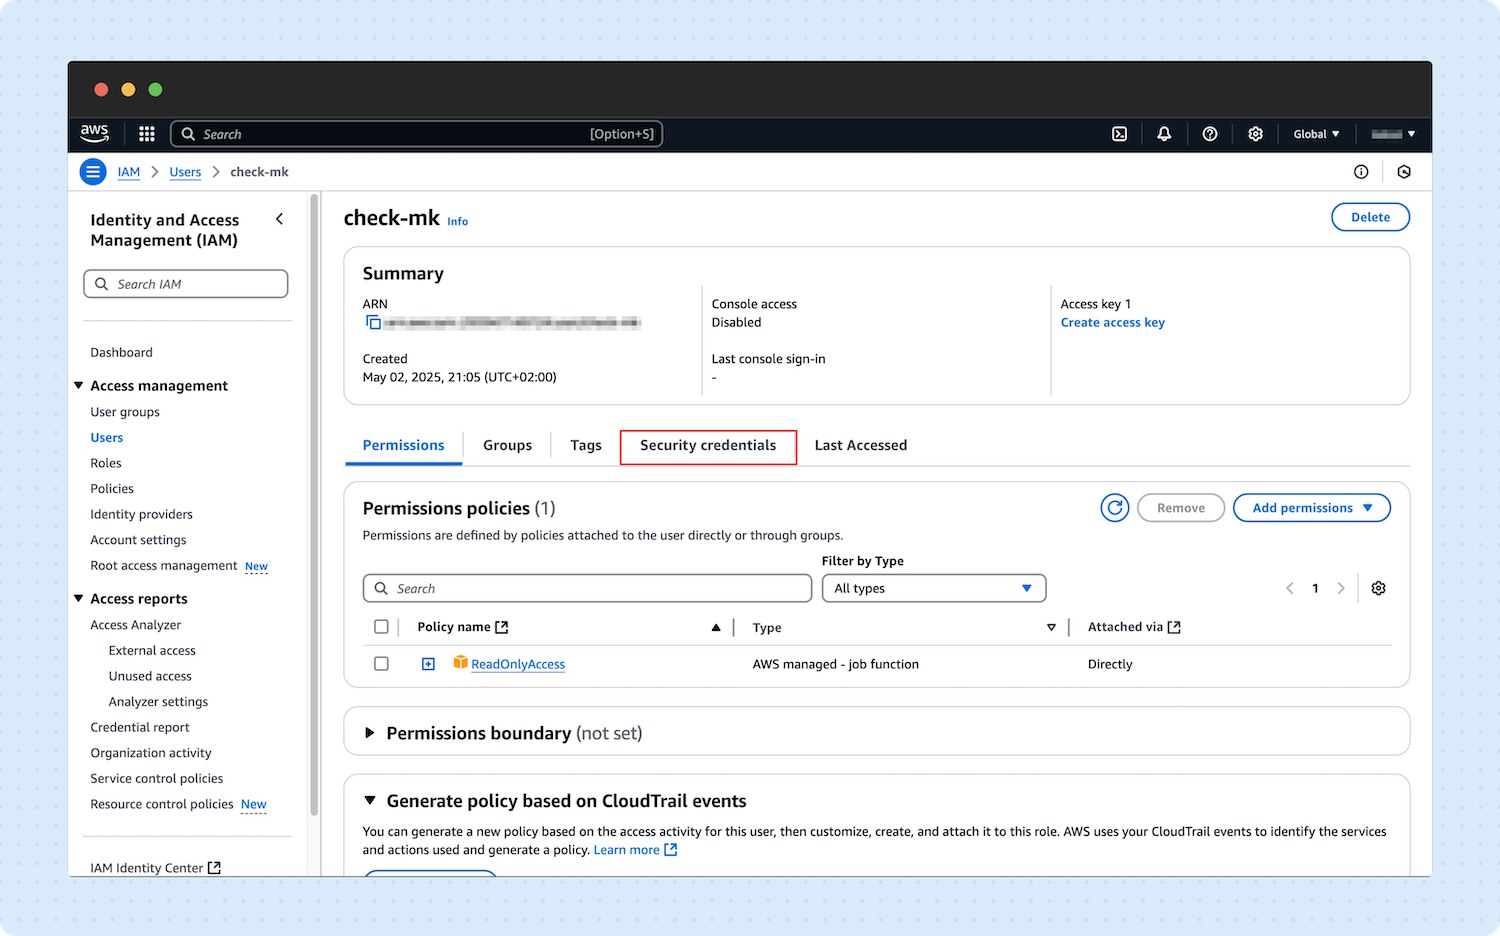
Select the newly created user.
Click Security credentials.
Now, click Create access key.
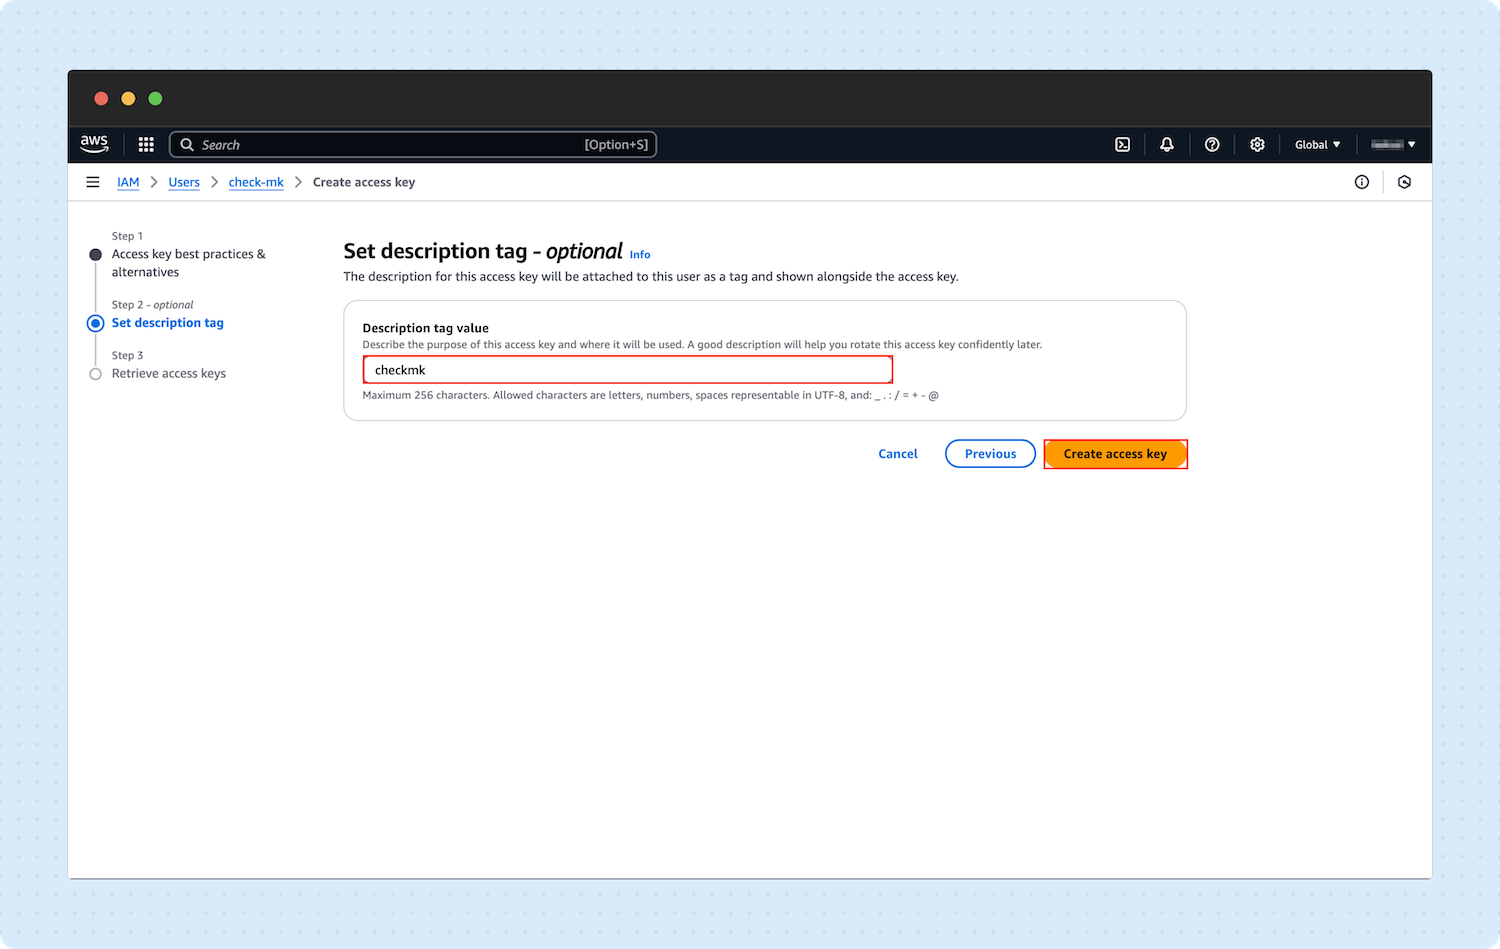
Select Third-party Service, accept the confirmation message, and click Next.
Optional: Set a description tag.
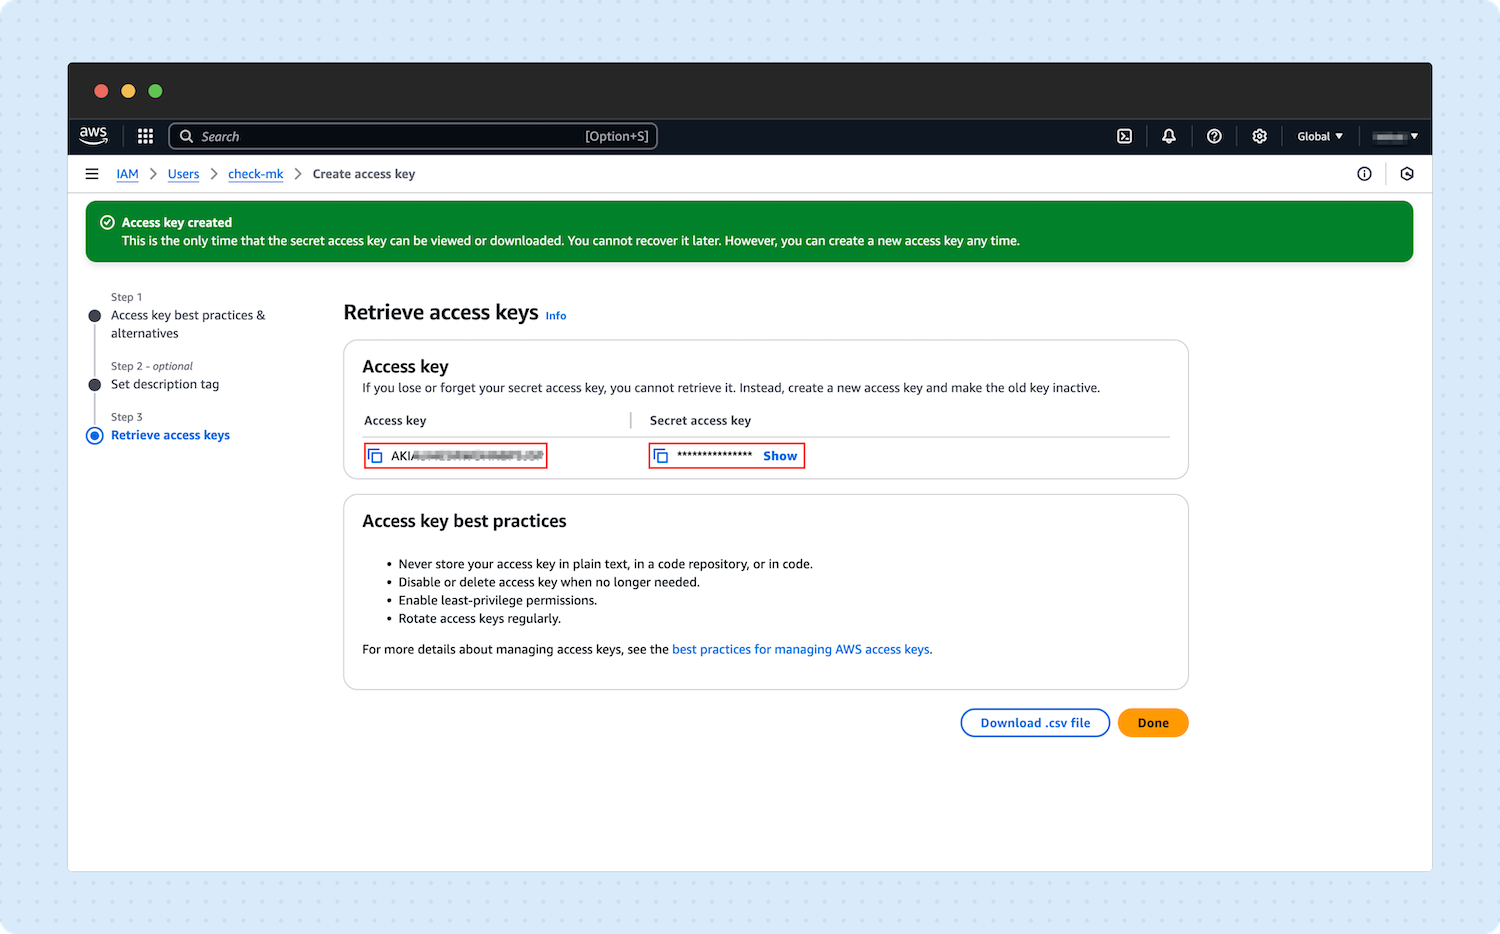
An Access key and Secret key will be generated. You will need these two keys in the setup process for Checkmk Cloud cloud-based monitoring.
Stage 3: Adding an AWS host
On the sidebar, click Setup -> Hosts.
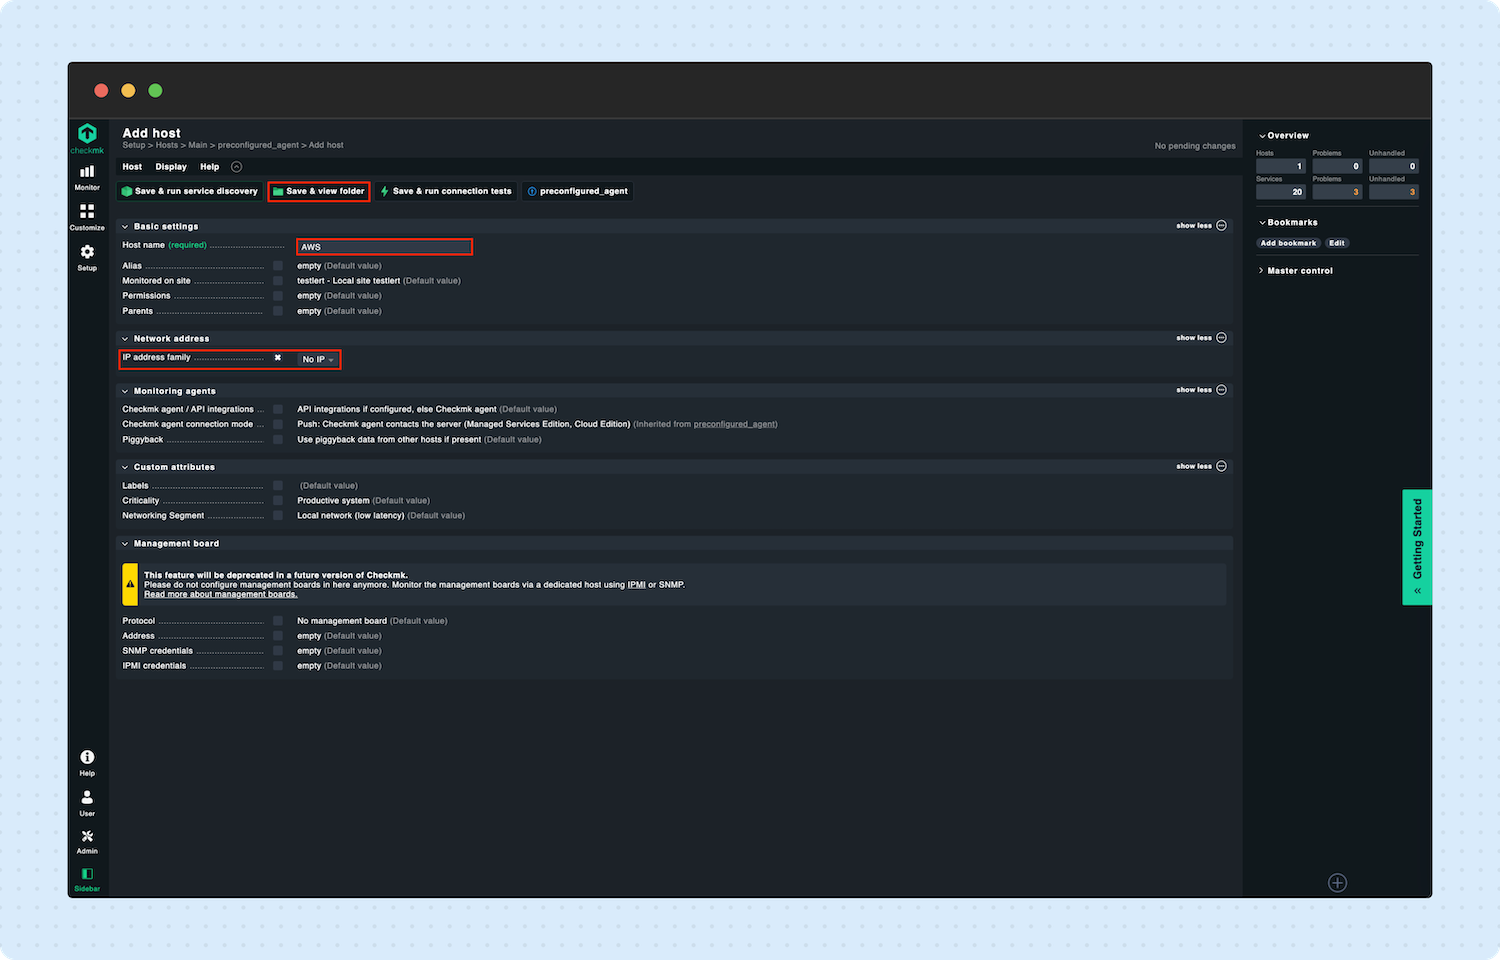
Click Add host.
Enter a Host name and set the IP address family to ‘No IP,’ then save the host.
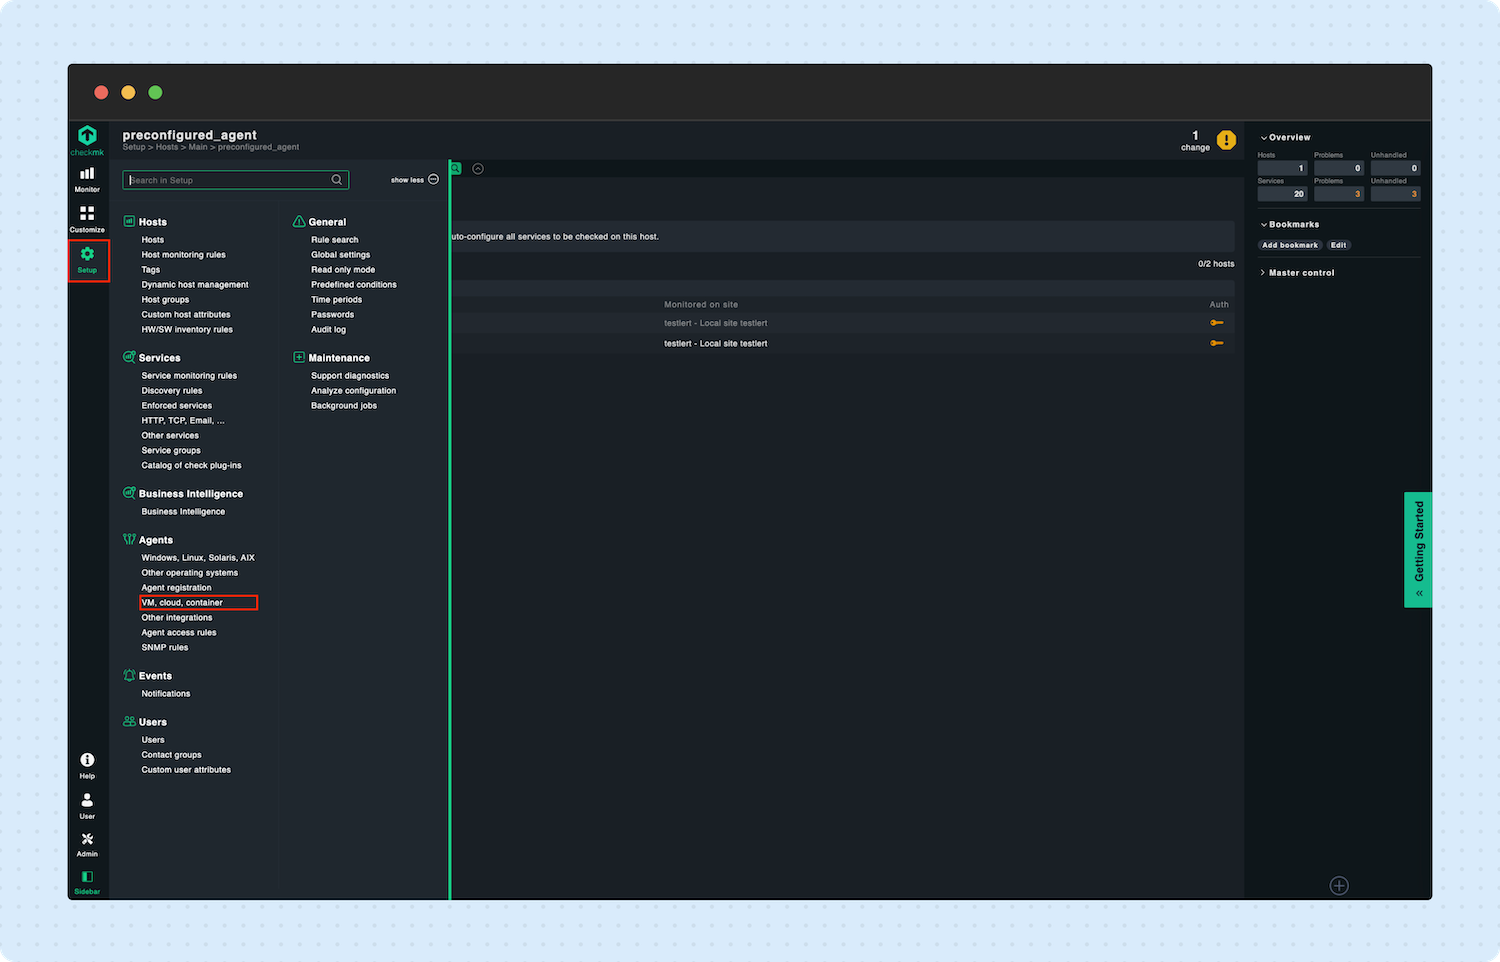
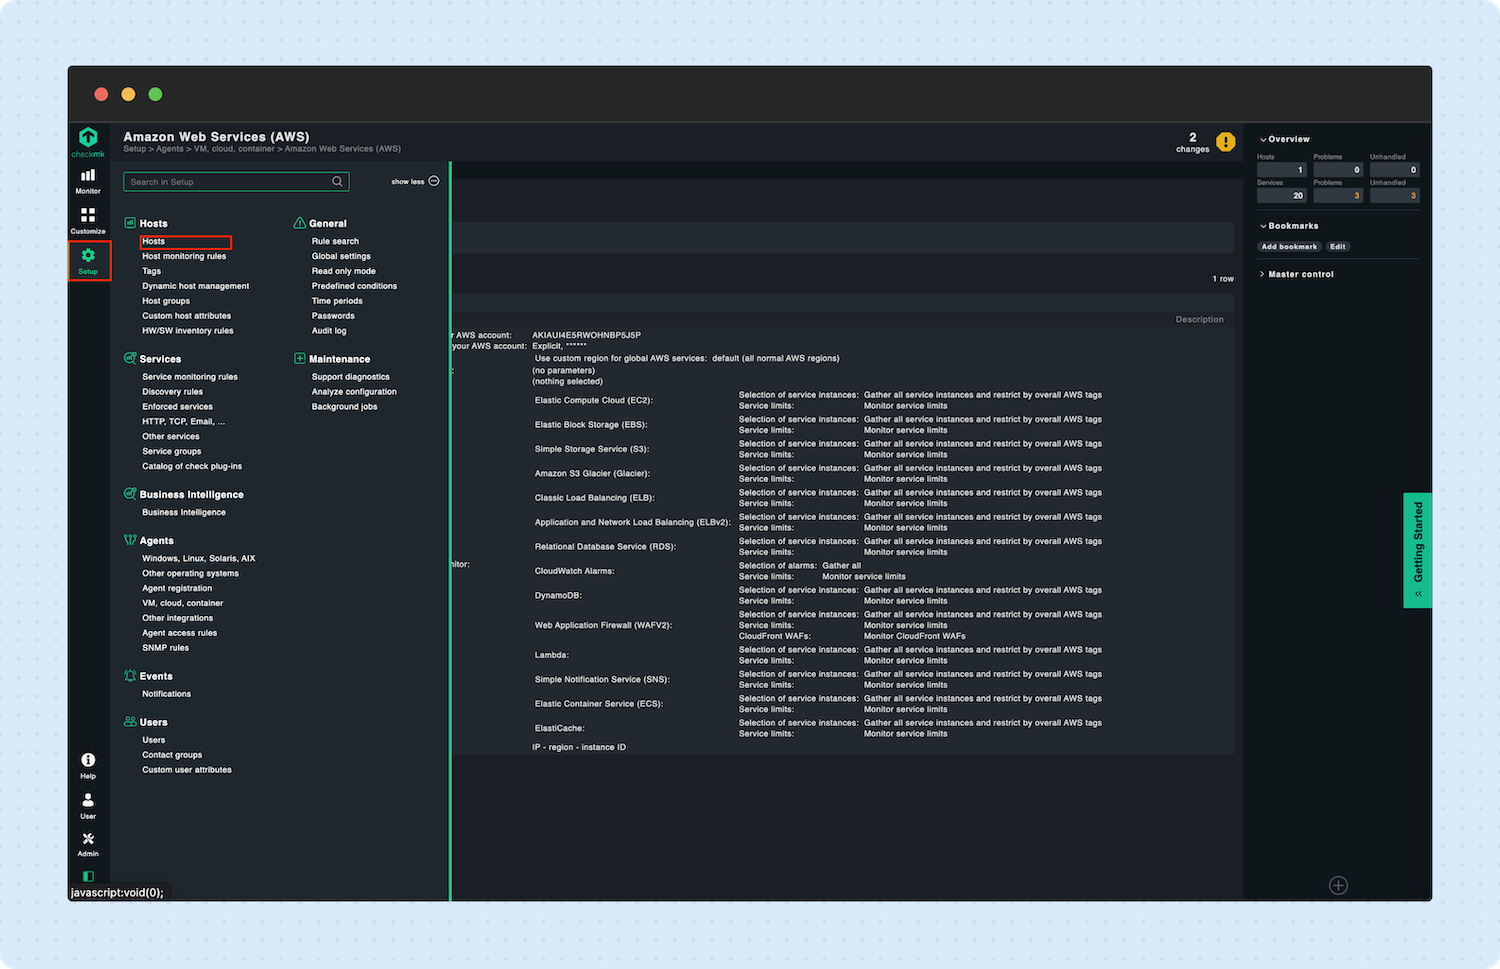
In the sidebar, navigate to Setup -> VM, cloud, container.
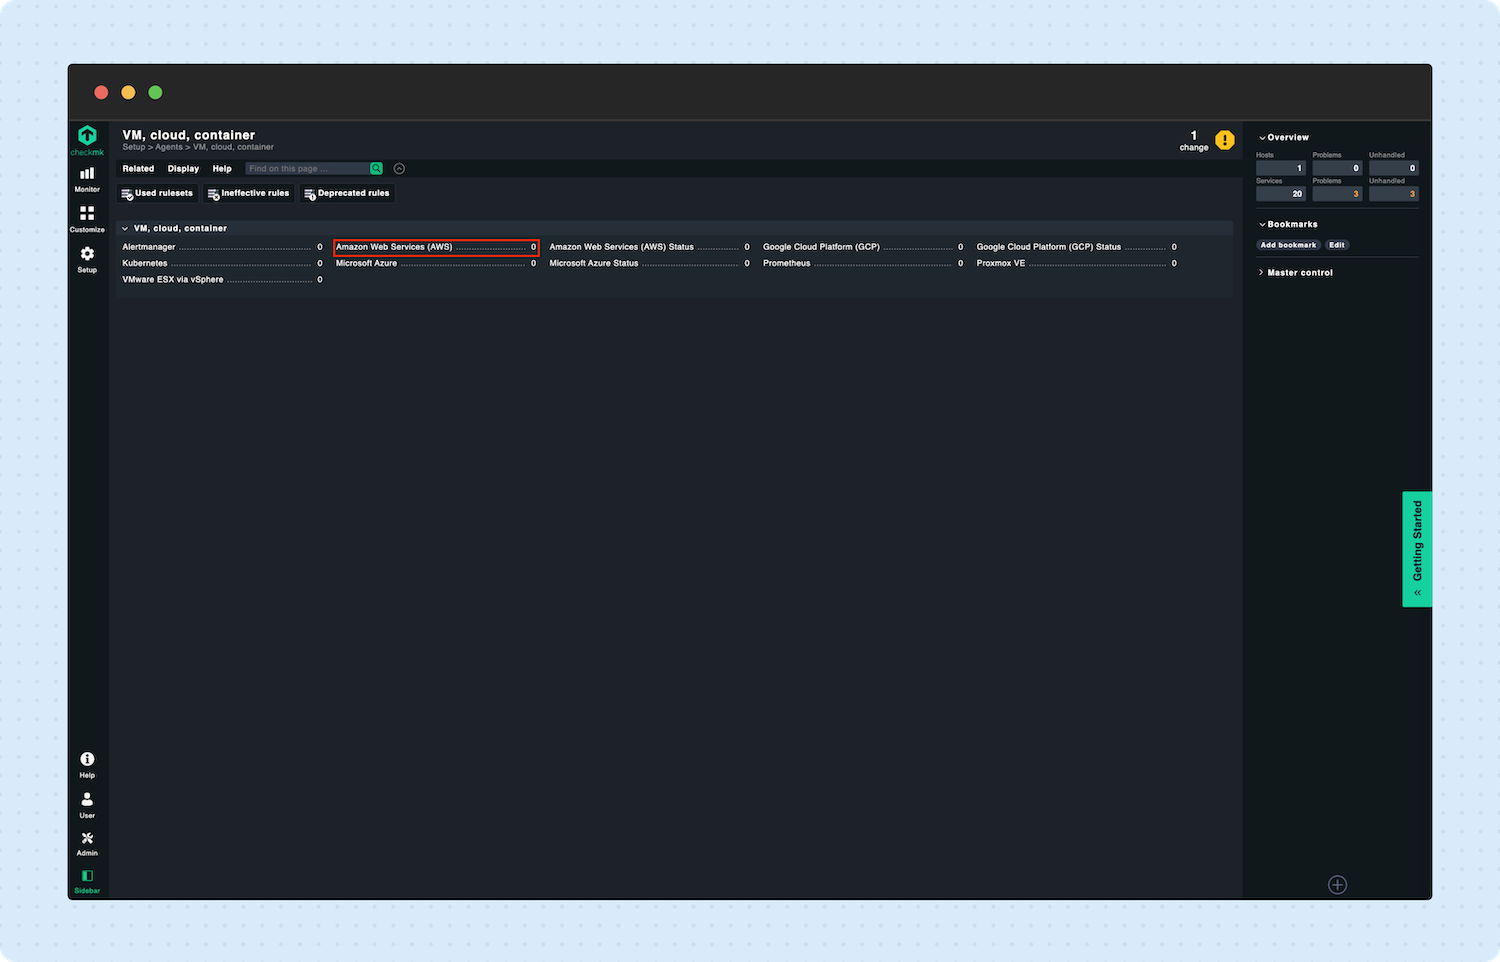
Now, select Amazon Web Services (AWS).
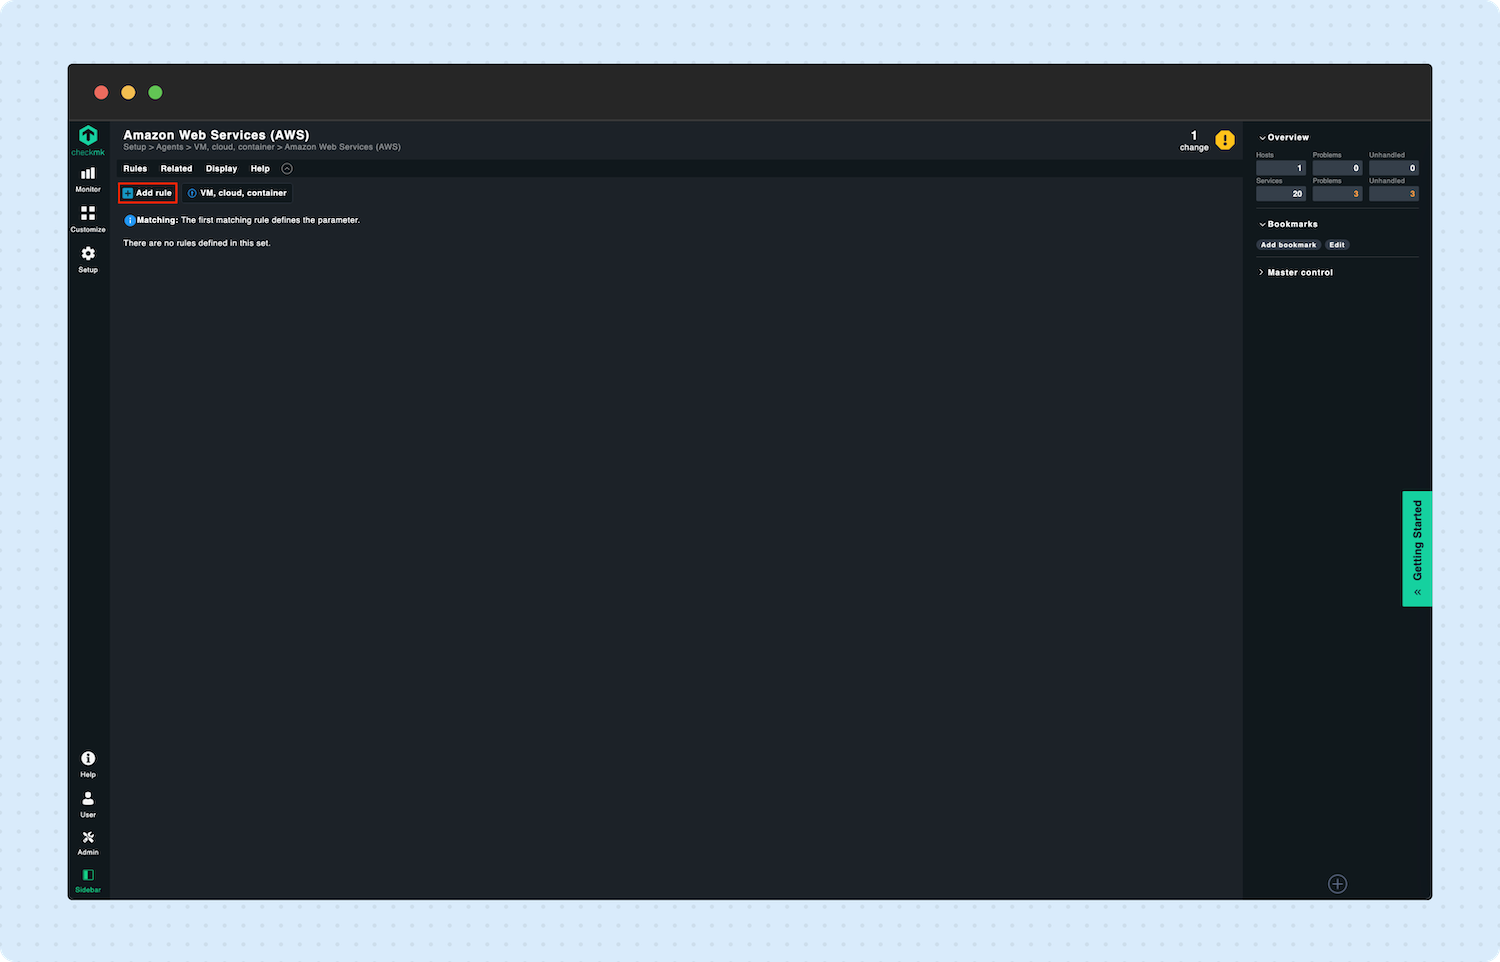
Click Add rule.
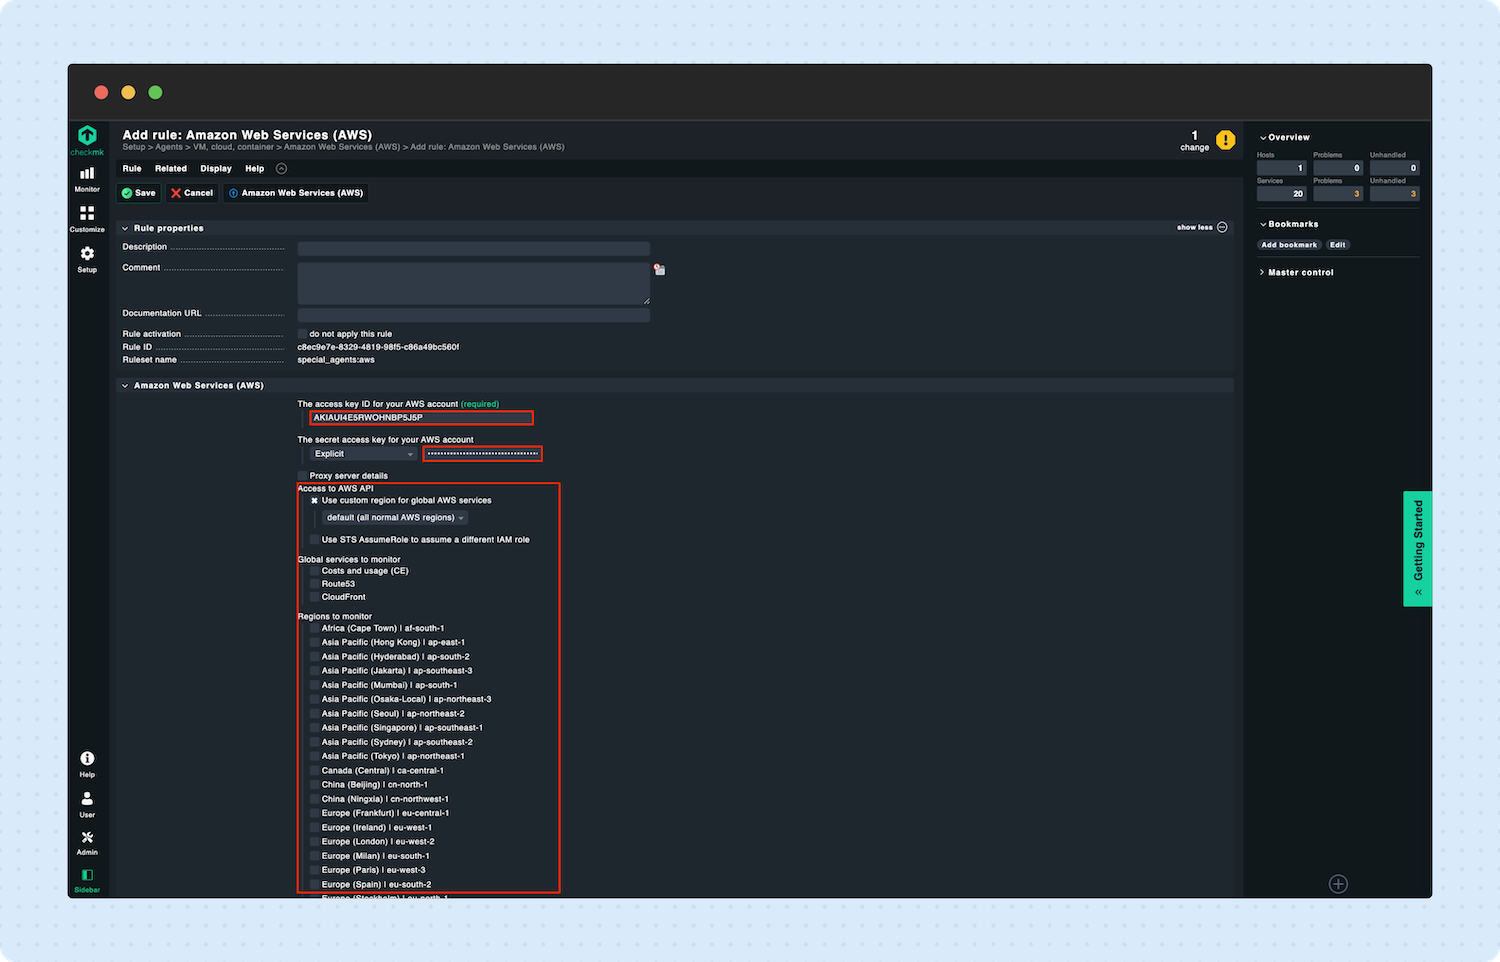
Enter the access key ID and the secret access key from your AWS account into the corresponding fields.
Select the options you want to monitor.
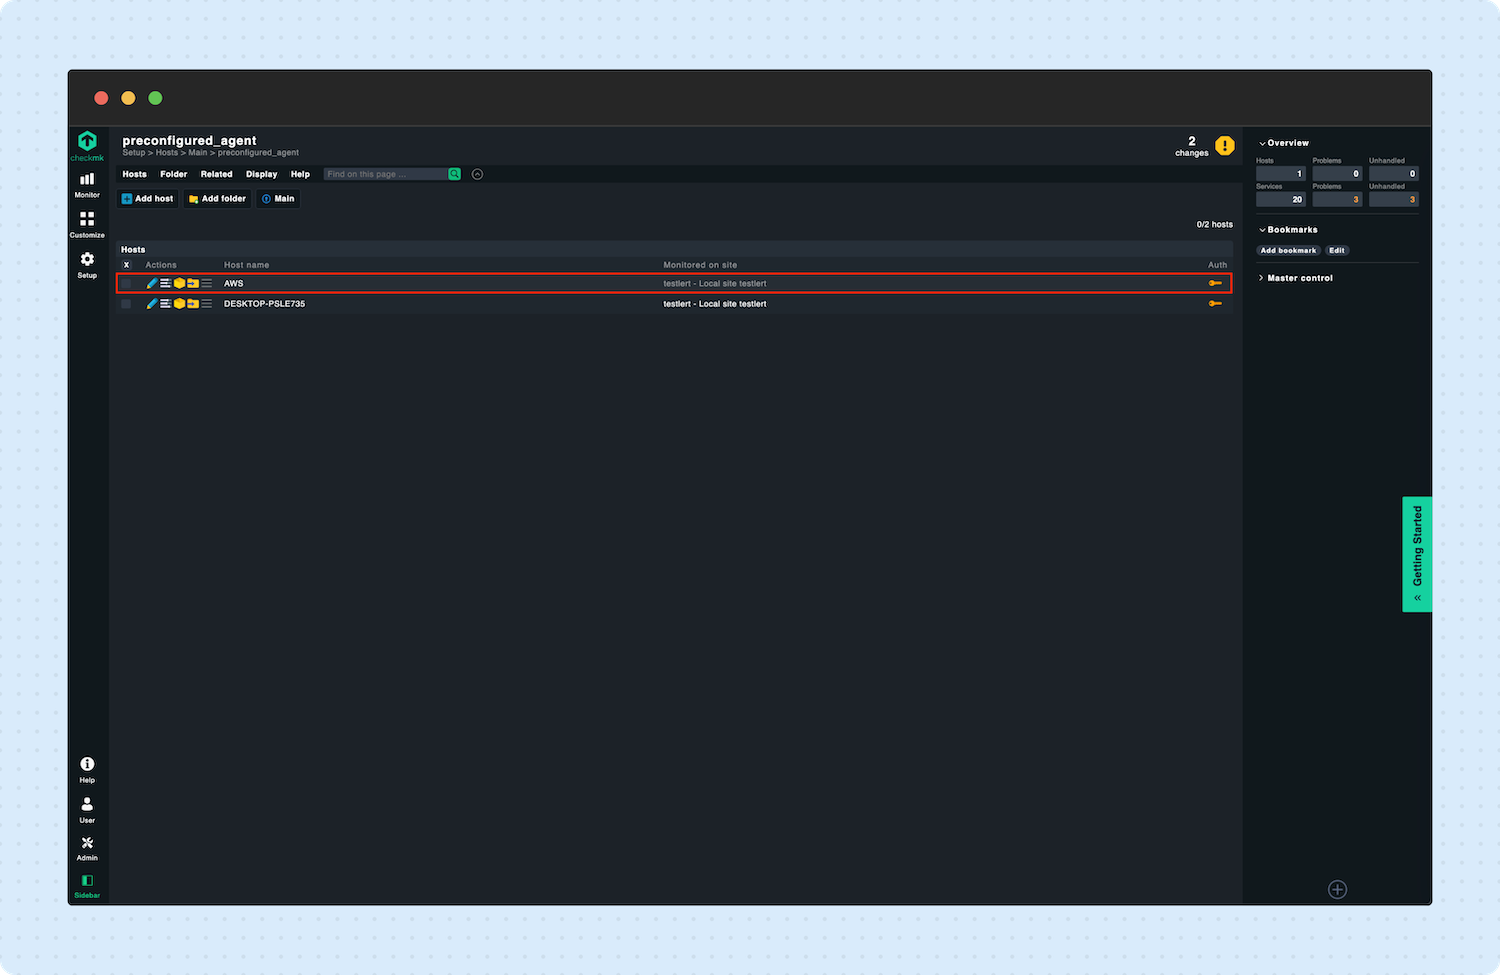
Now, in the sidebar, navigate to Setup -> Hosts.
Select the previously created host.
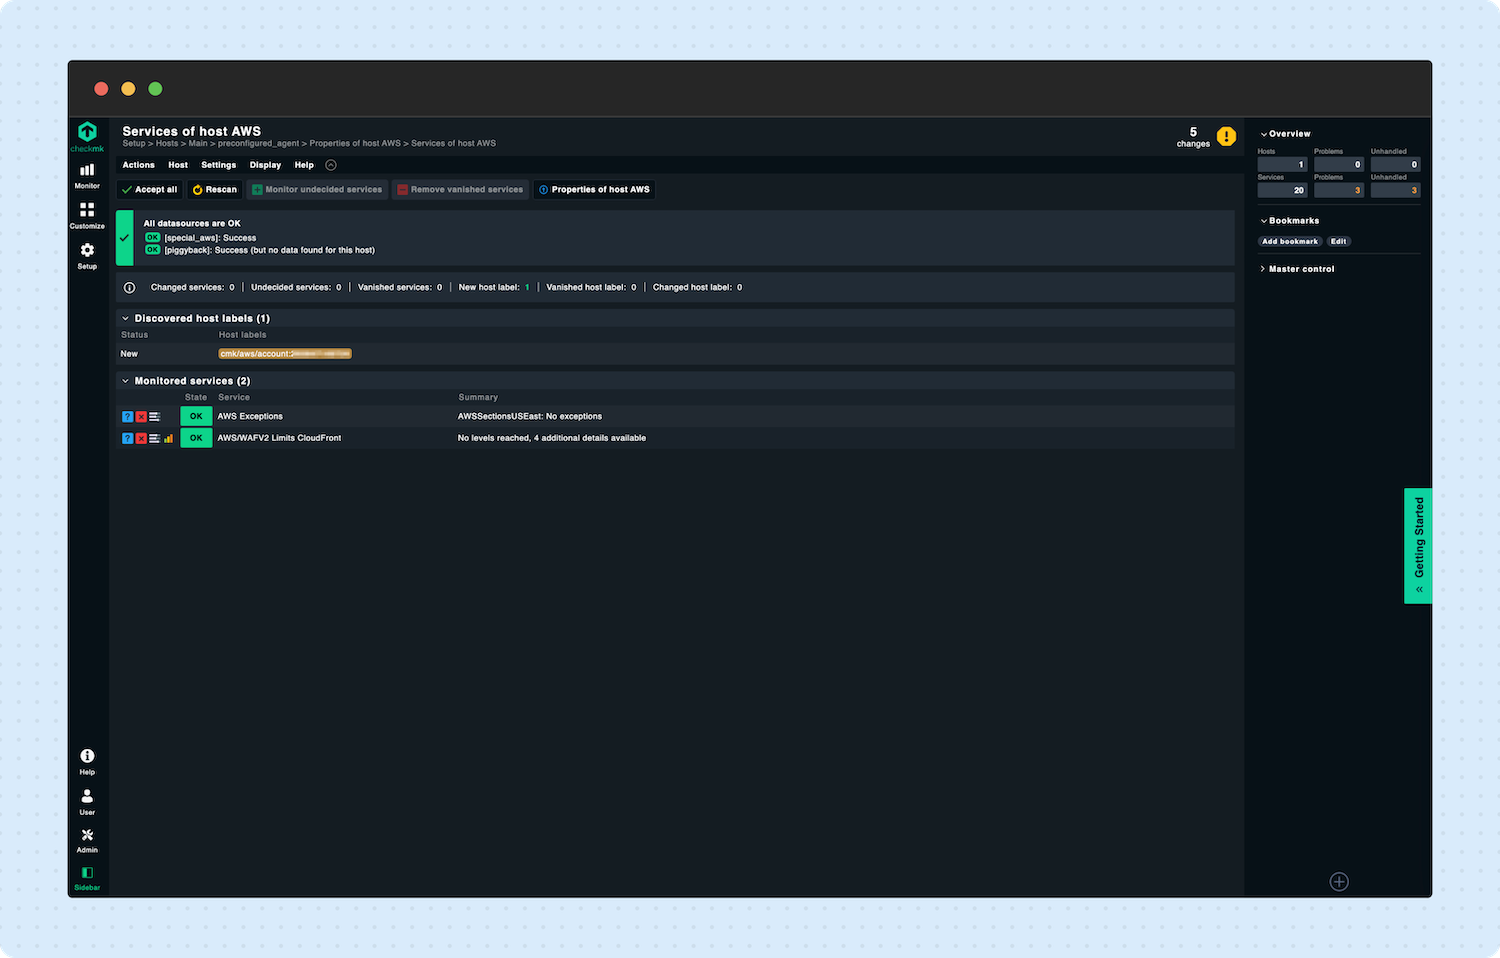
Click Save & run service discovery.
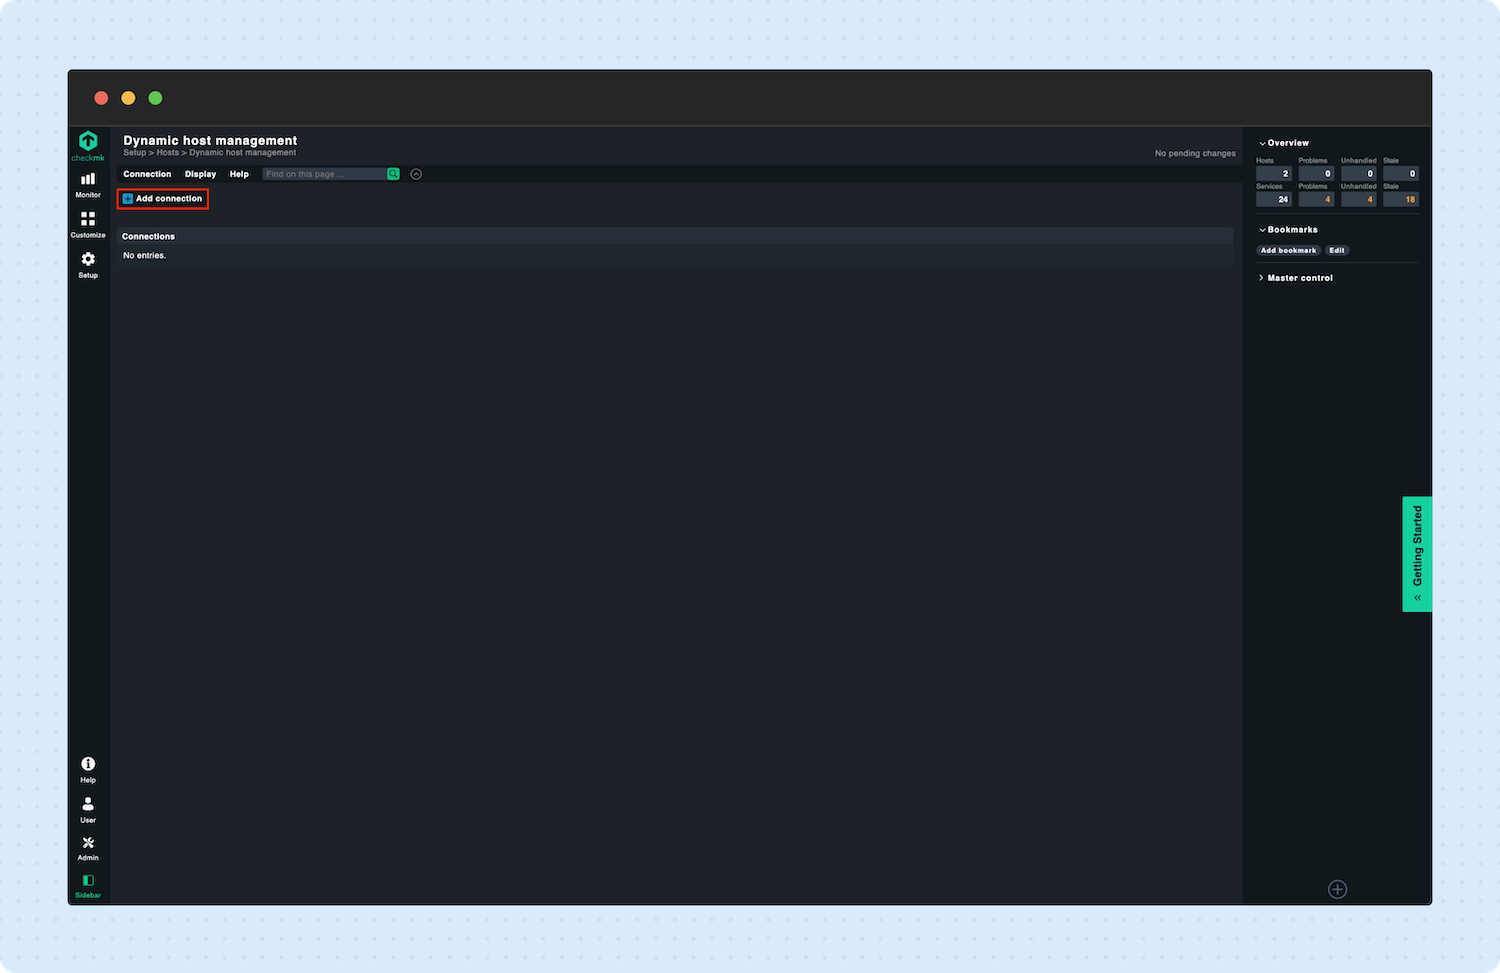
Navigate to Setup -> Dynamic host management.
Click Add connection.
Enter a Unique ID and Title in the corresponding fields.
Enable ‘Automatically delete hosts without piggyback’ in the Delete vanished hosts settings.
Save the connection.
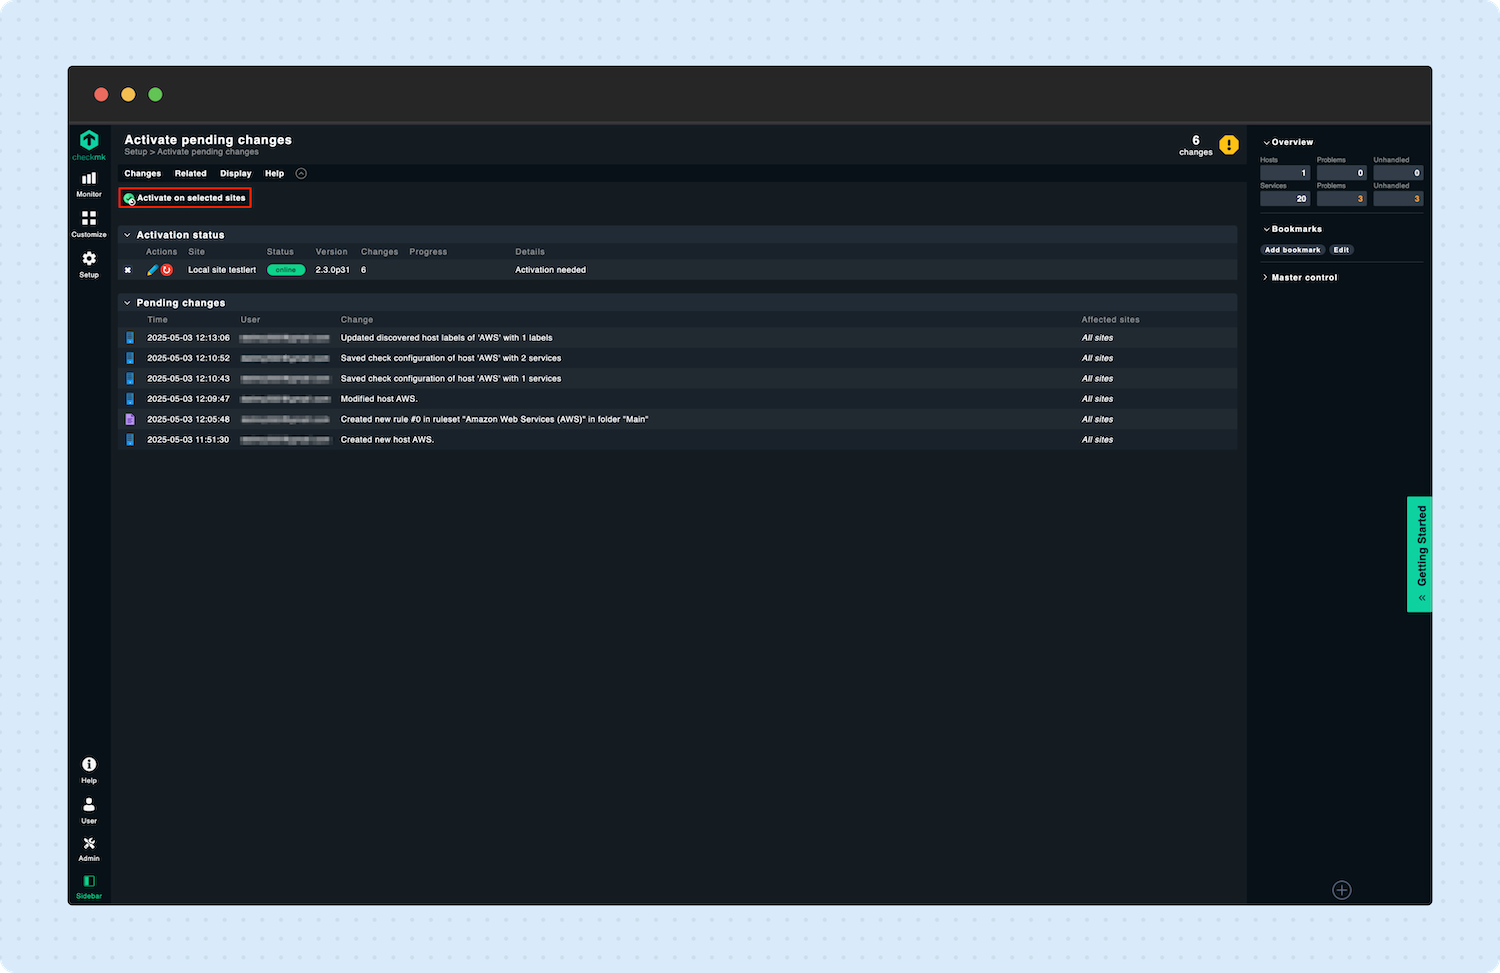
To apply the changes made, in the top right corner, click the Changes.
Now, click Activate on selected sites.
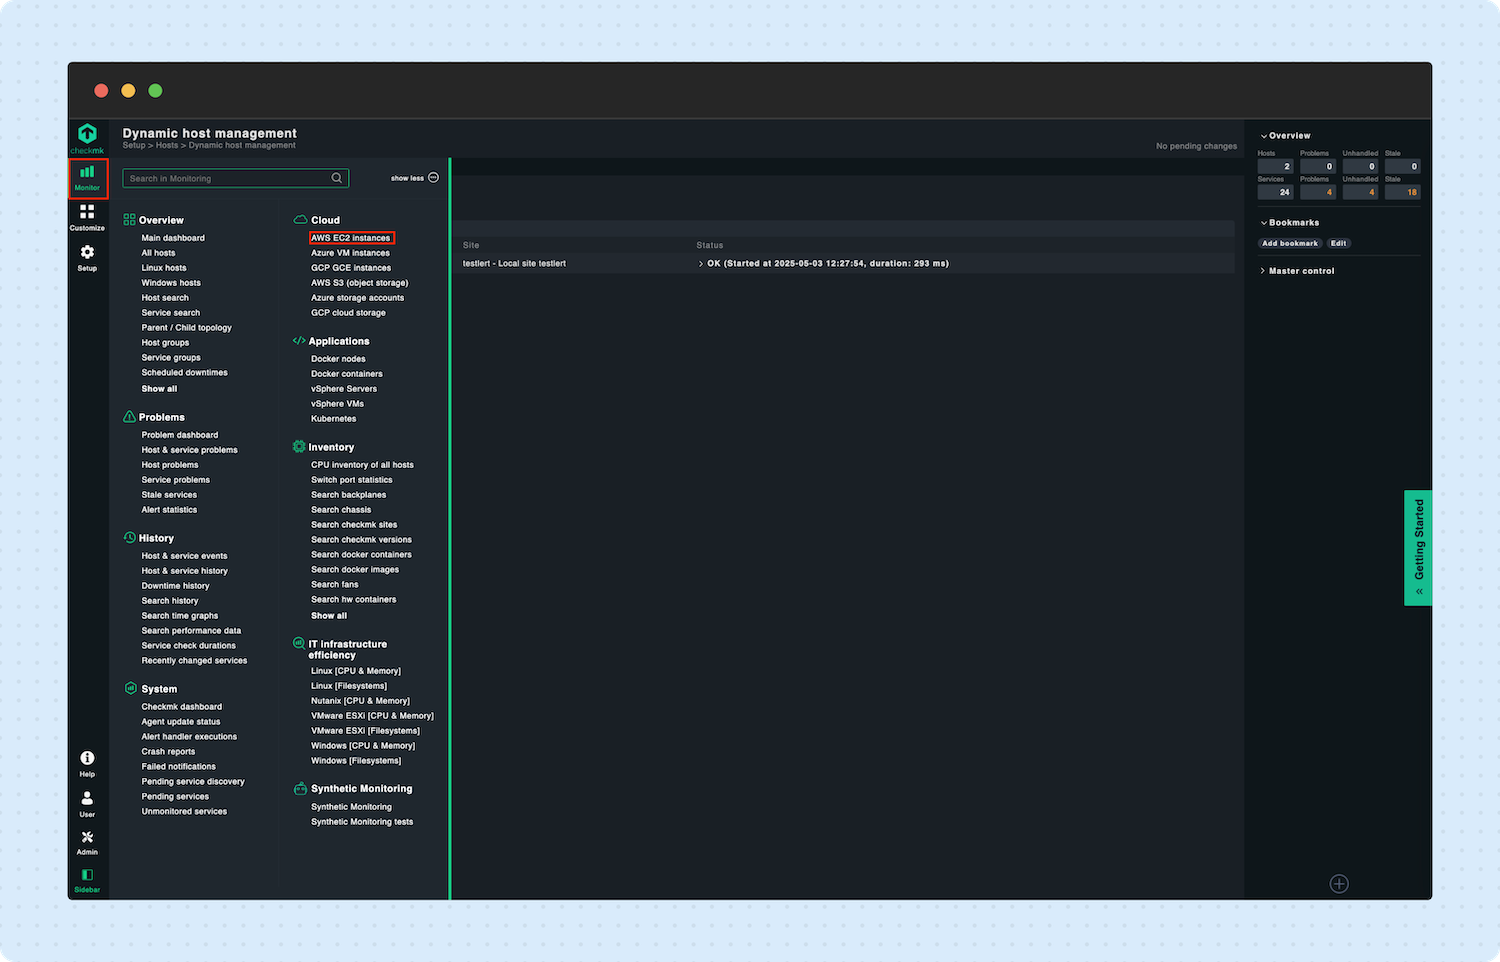
In the sidebar, navigate to Monitor -> AWS EC2 instances.
This view is a general overview of your EC2 Instances.
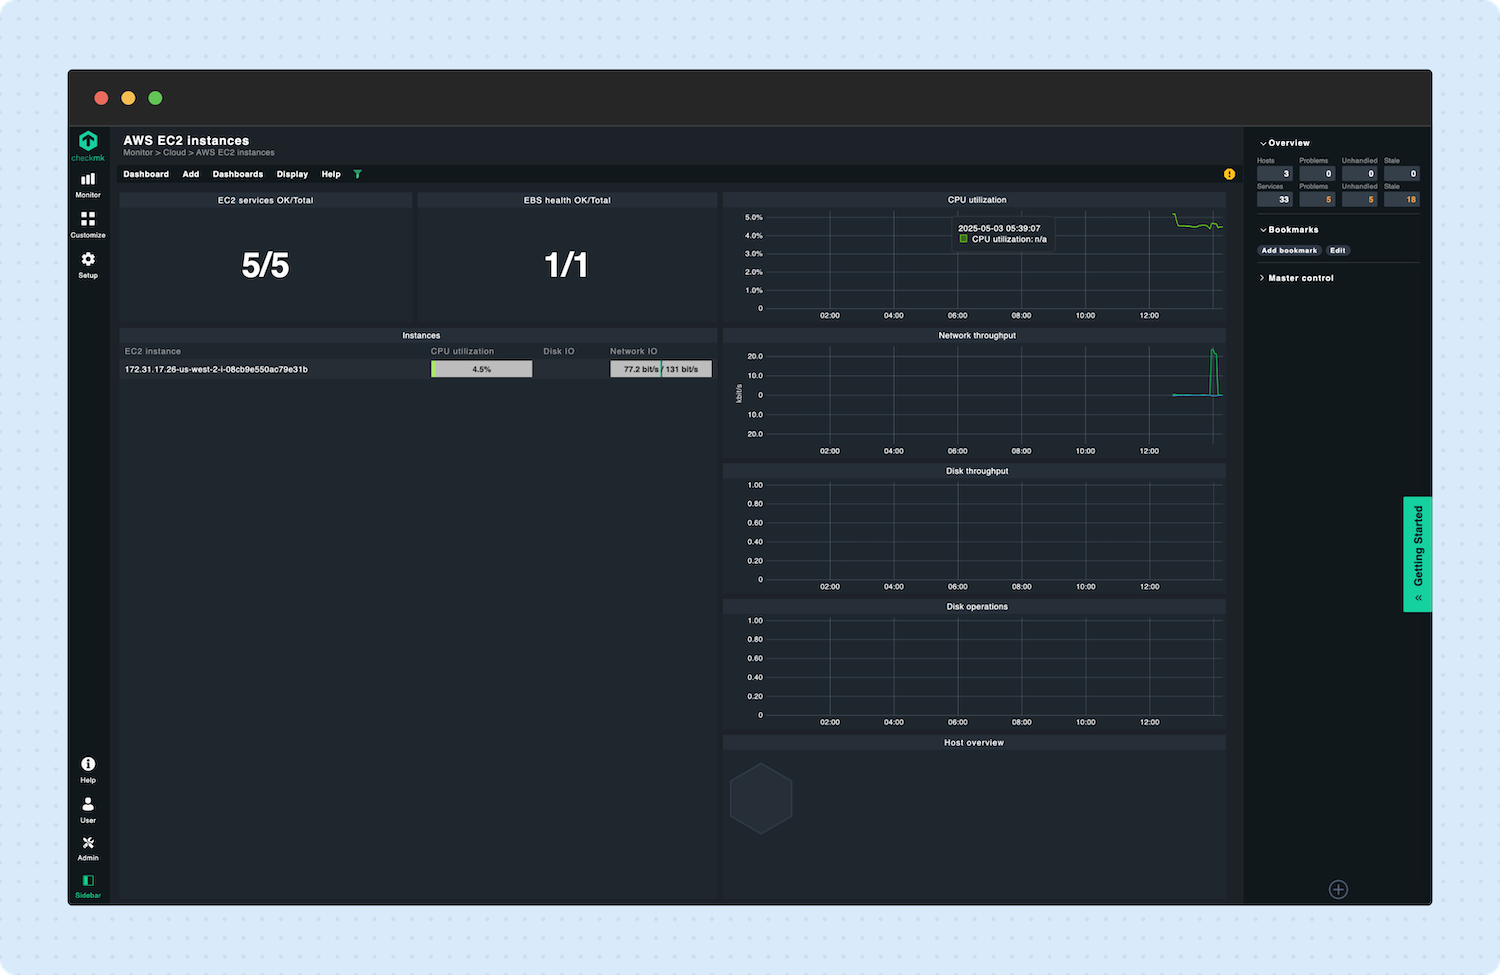
Stage 4: Build intuitive dashboards to monitor performance
Checkmk dashboards are customizable visual interfaces that provide real-time insights into the health and performance of your cloud and on-premises systems.
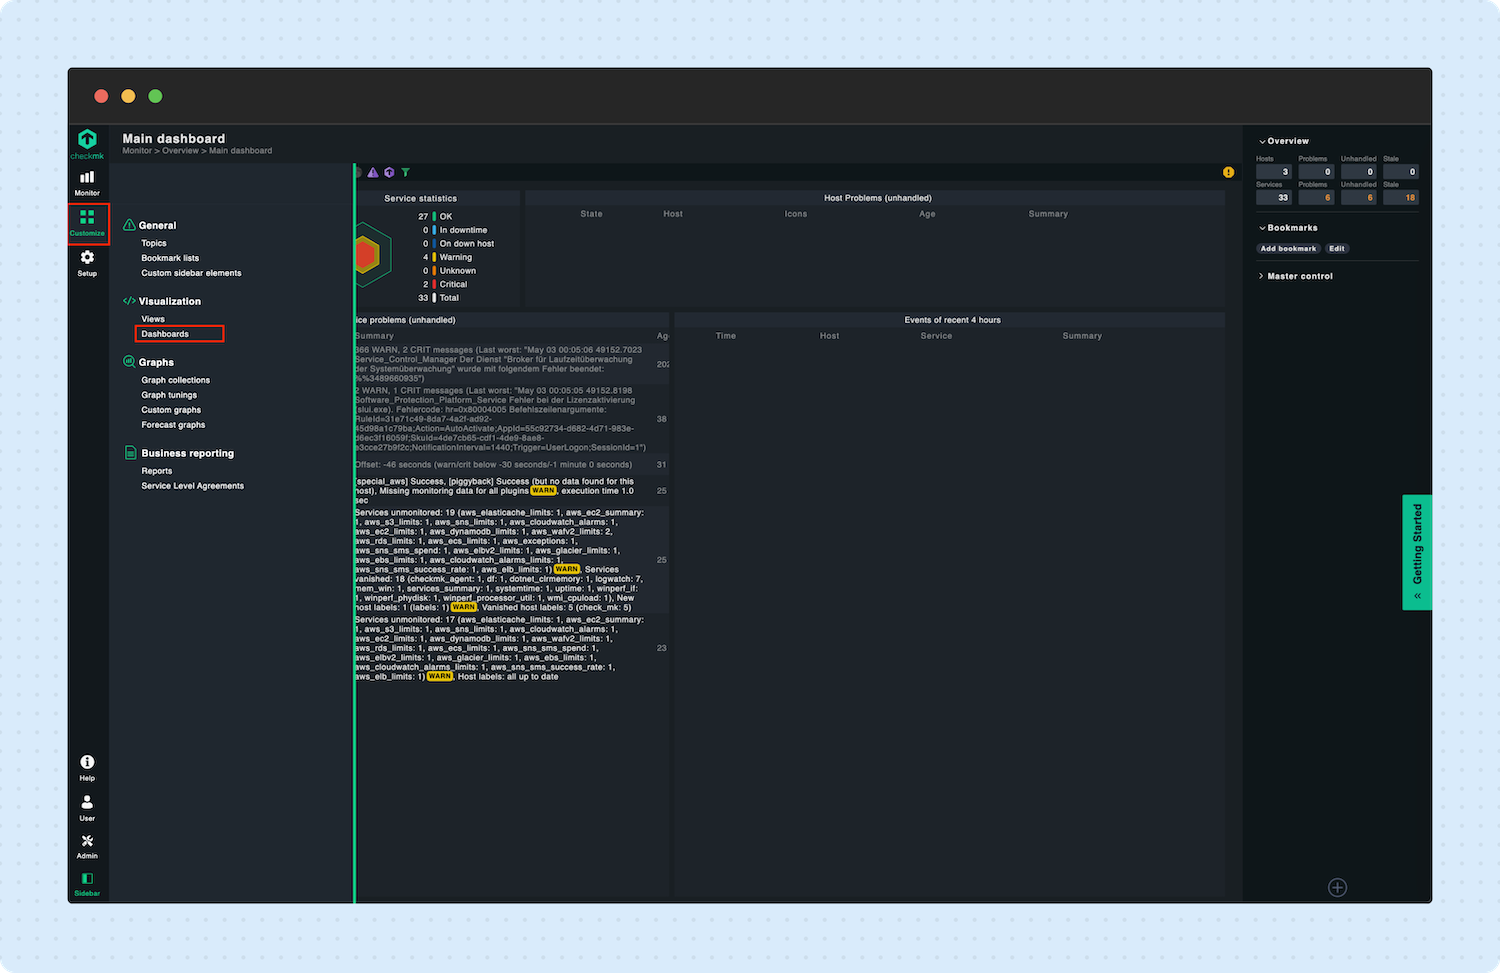
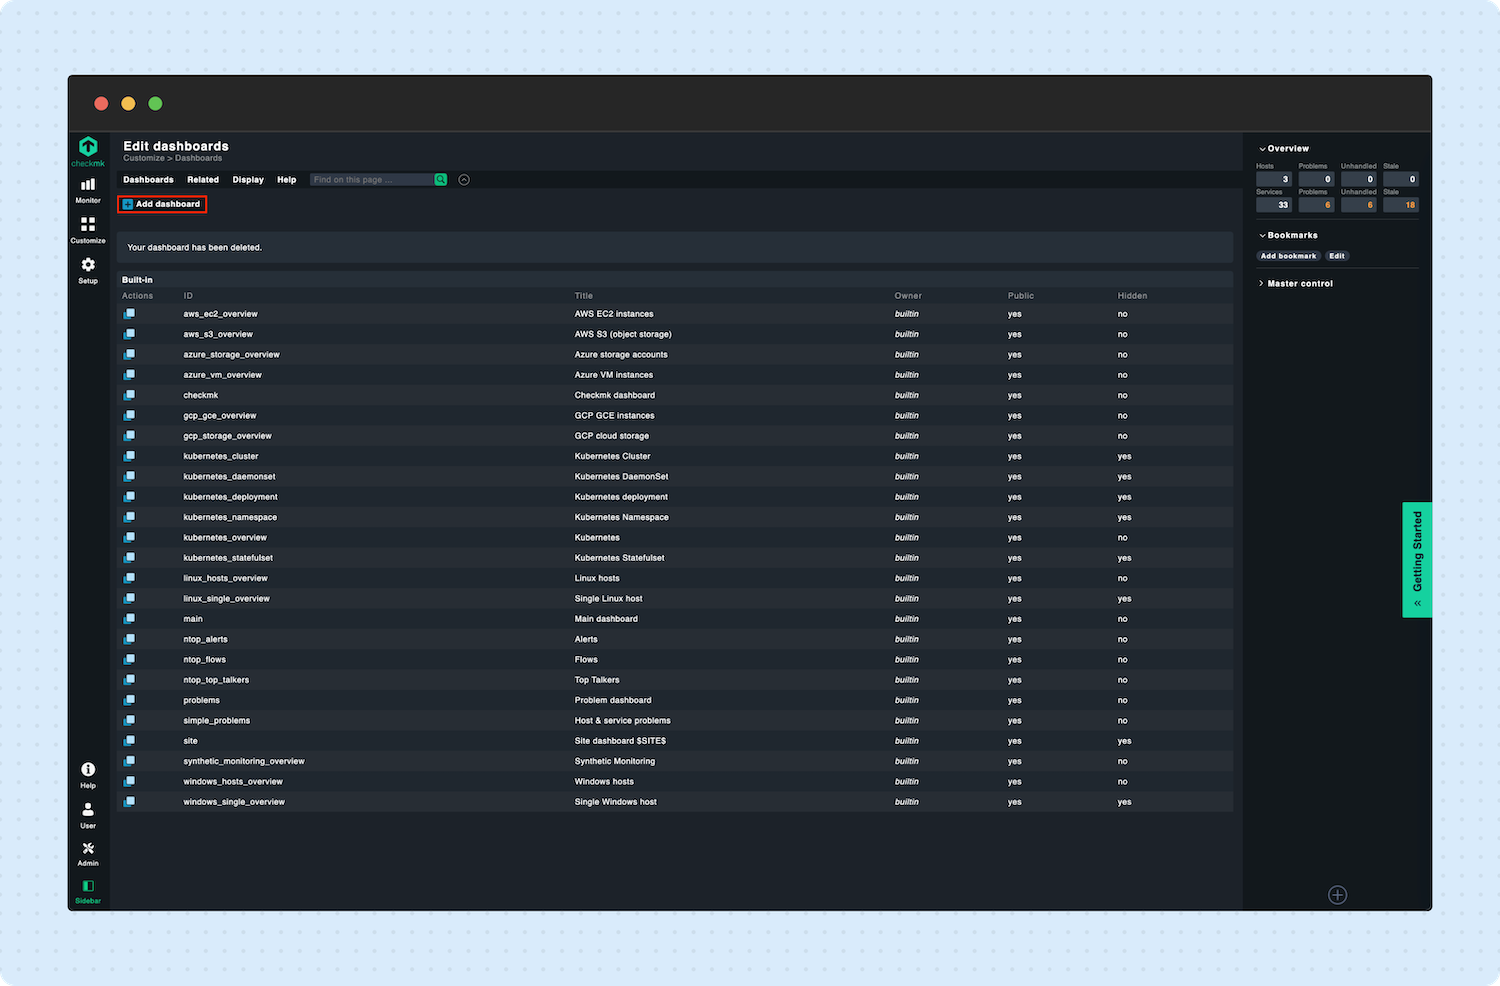
In the sidebar, navigate to Customize -> Dashboards.
Click on Add dashboard.
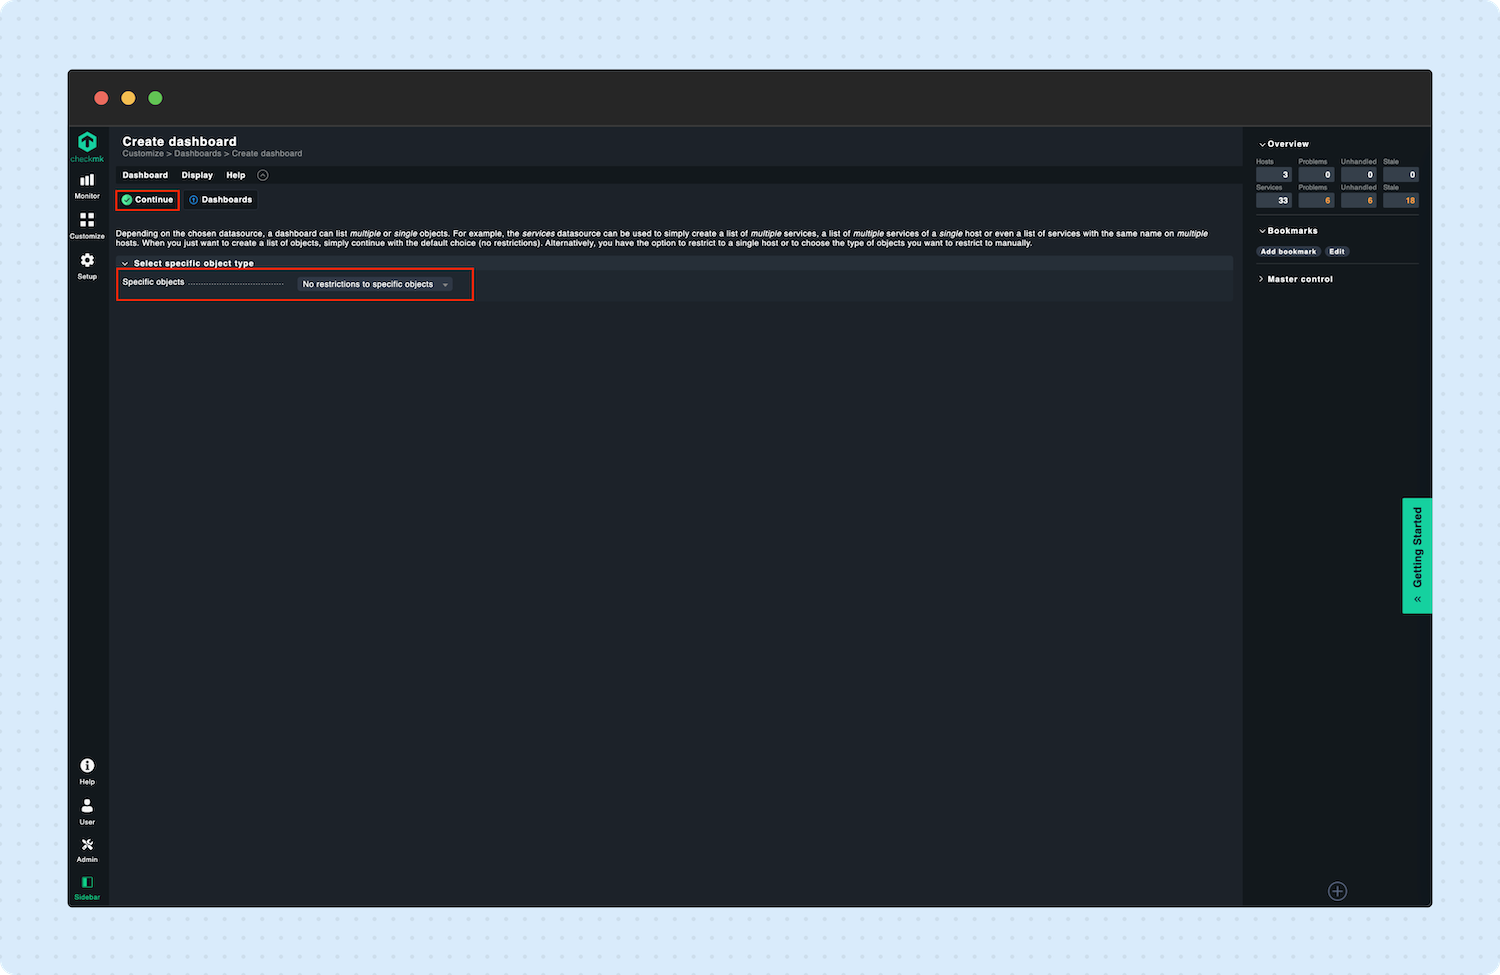
Select specific objects to which the dashboard is restricted. In this guide, we will set the restriction to: ‘No restrictions to specific objects.’
Click Continue.
Enter a Unique ID and Title and click Save & go to dashboard.
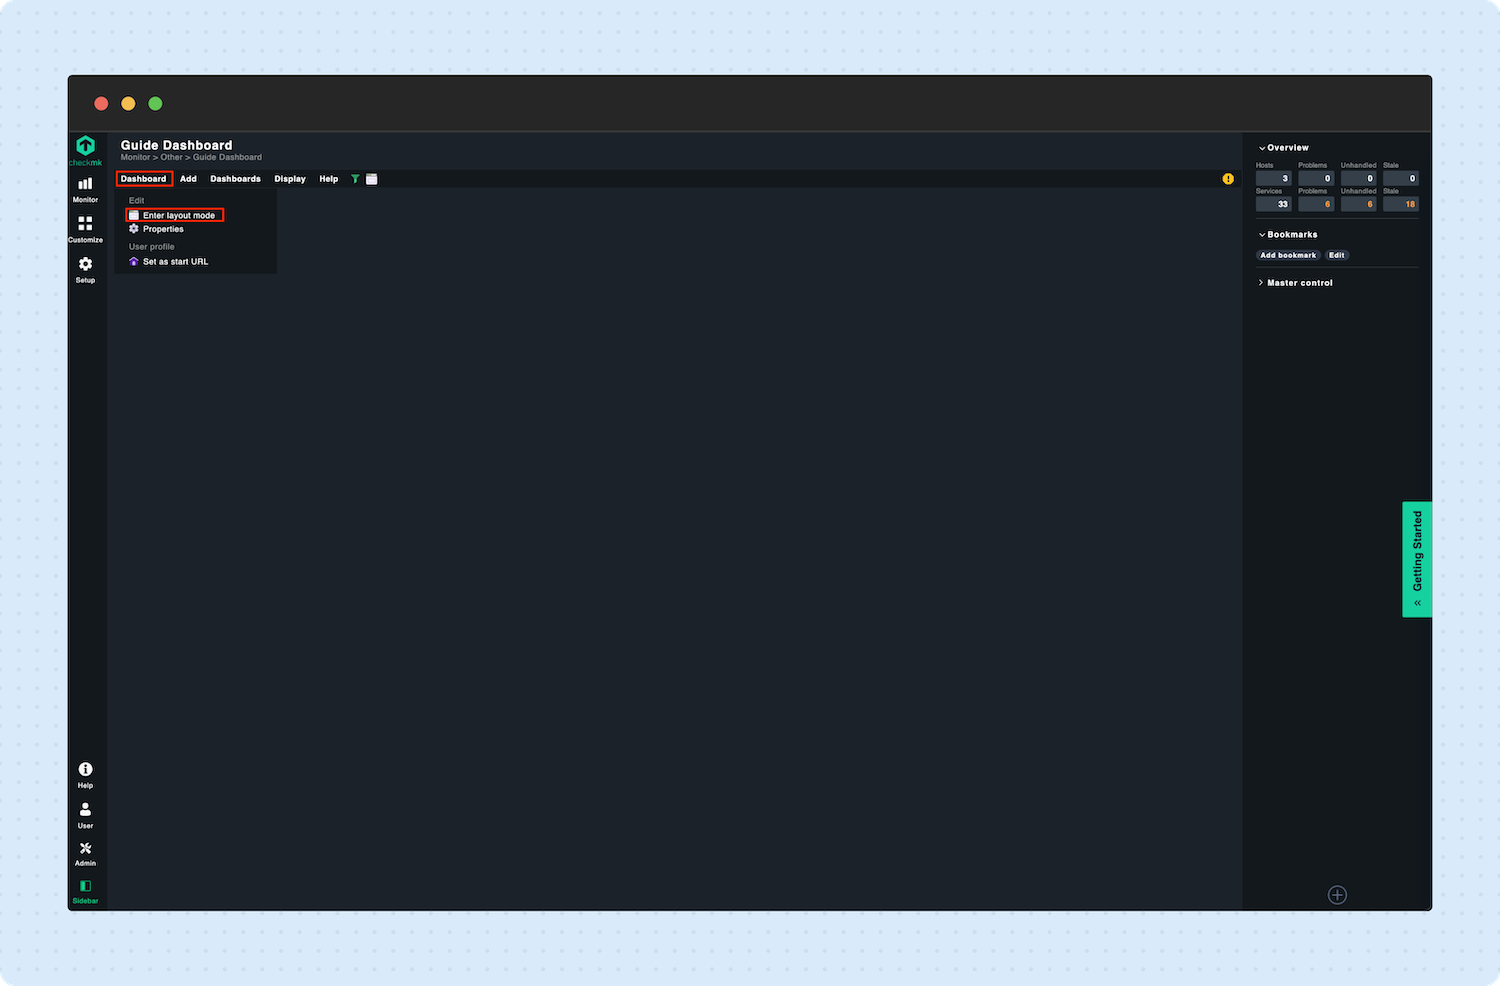
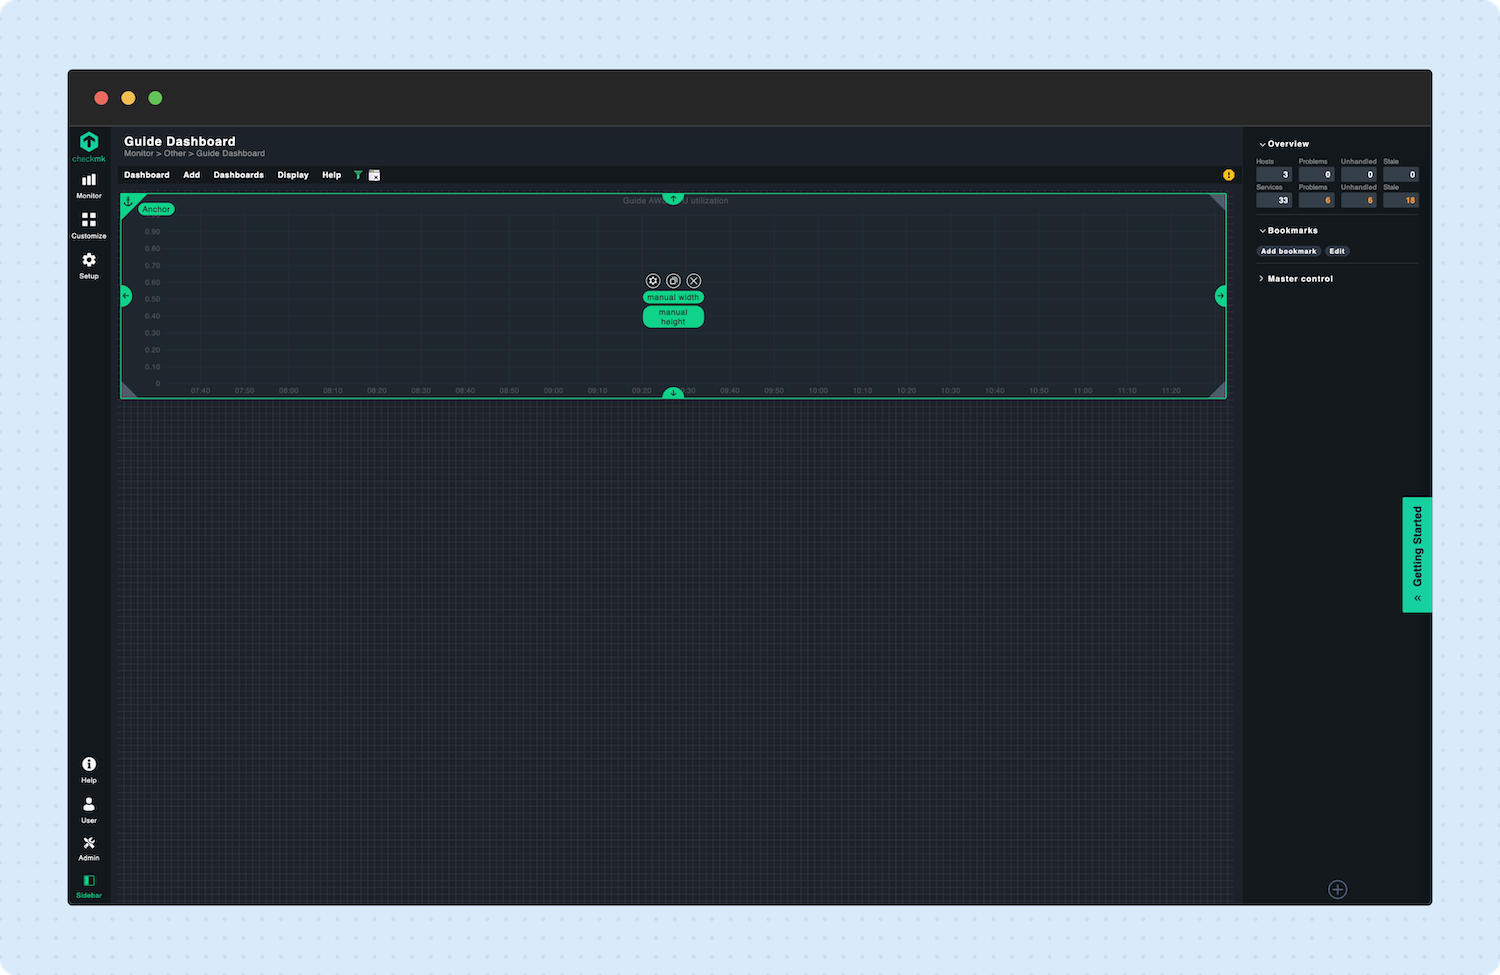
Now, navigate to Dashboard -> Enter layout mode.
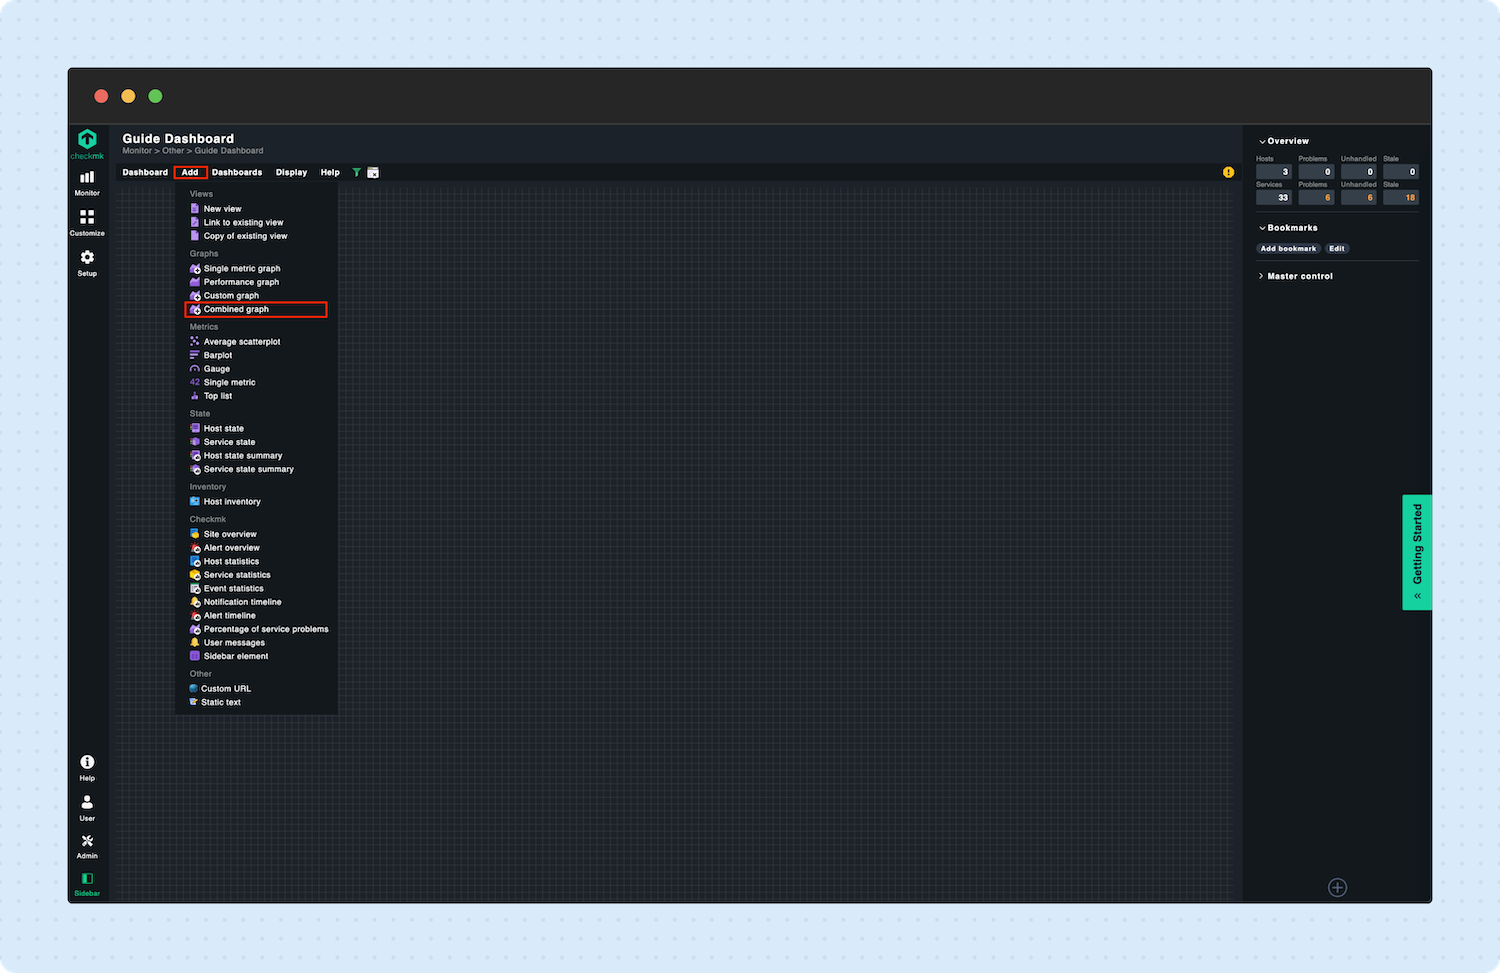
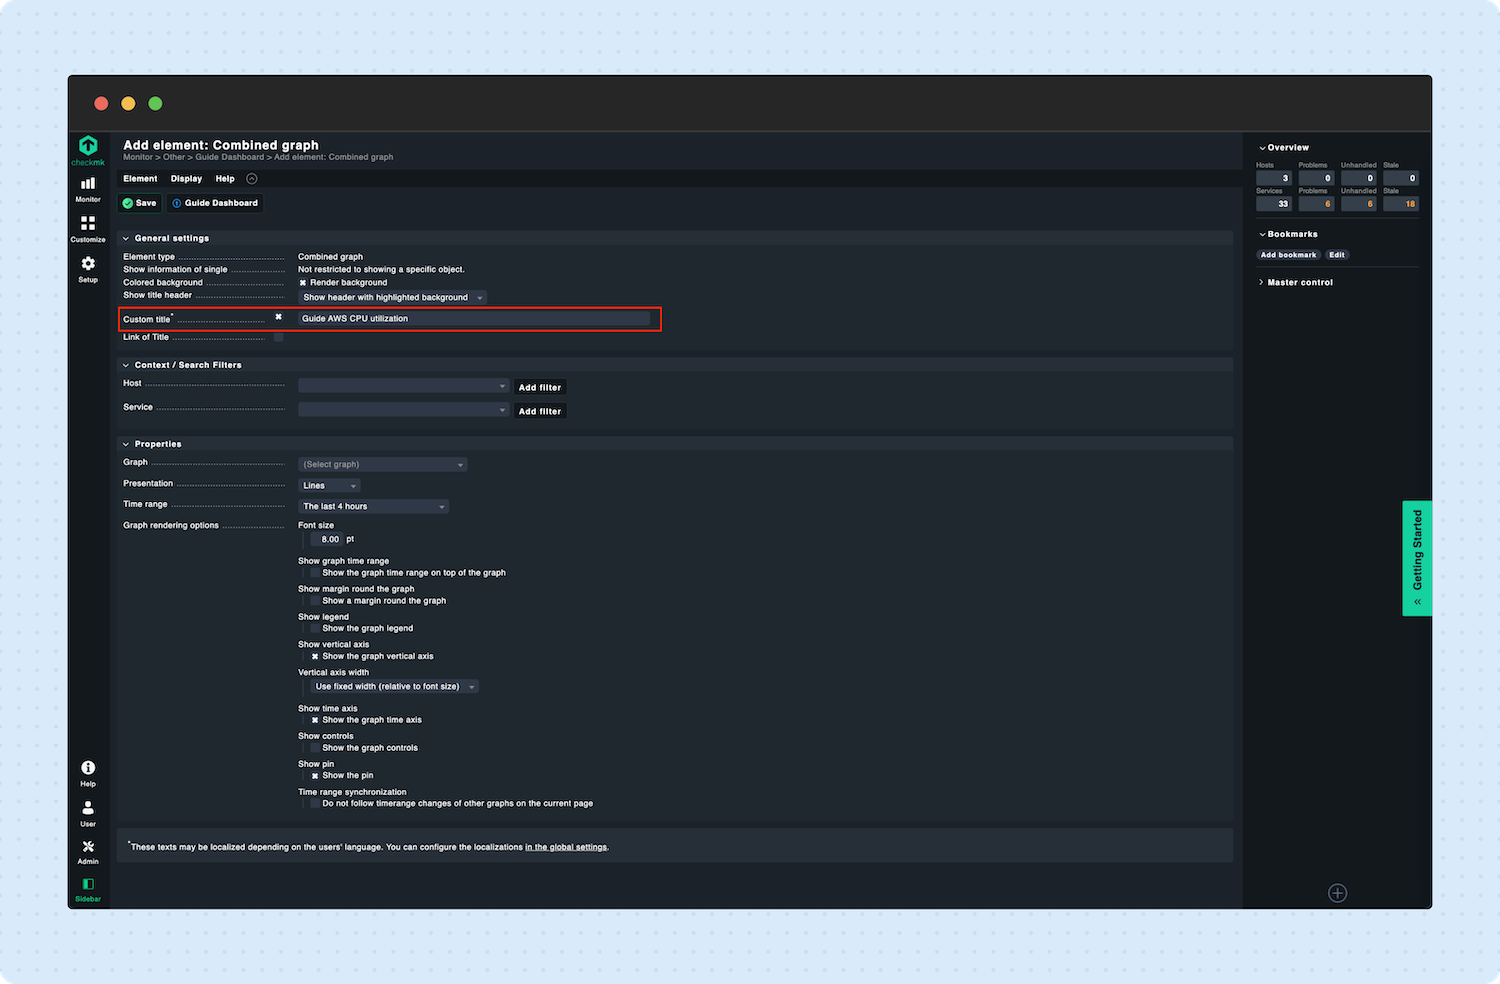
Navigate to Add -> Combined graph.
Enter a Custom title for the graph.
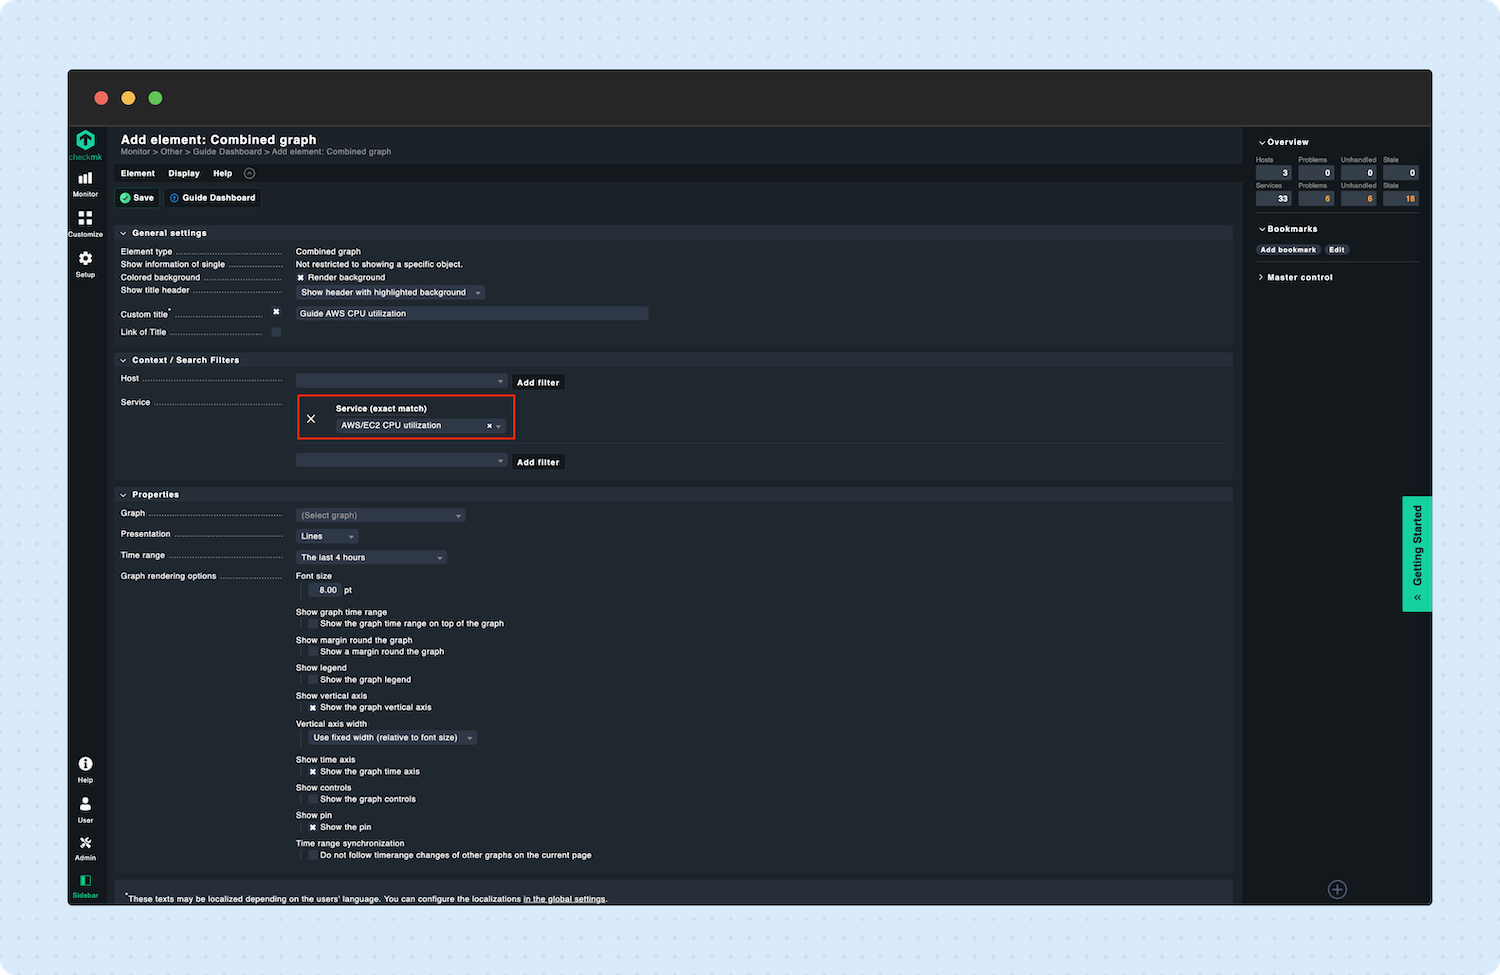
Select the Service filter condition ‘Service (exact match)’ and enter ‘AWS/EC2 CPU utilization’ as the value.
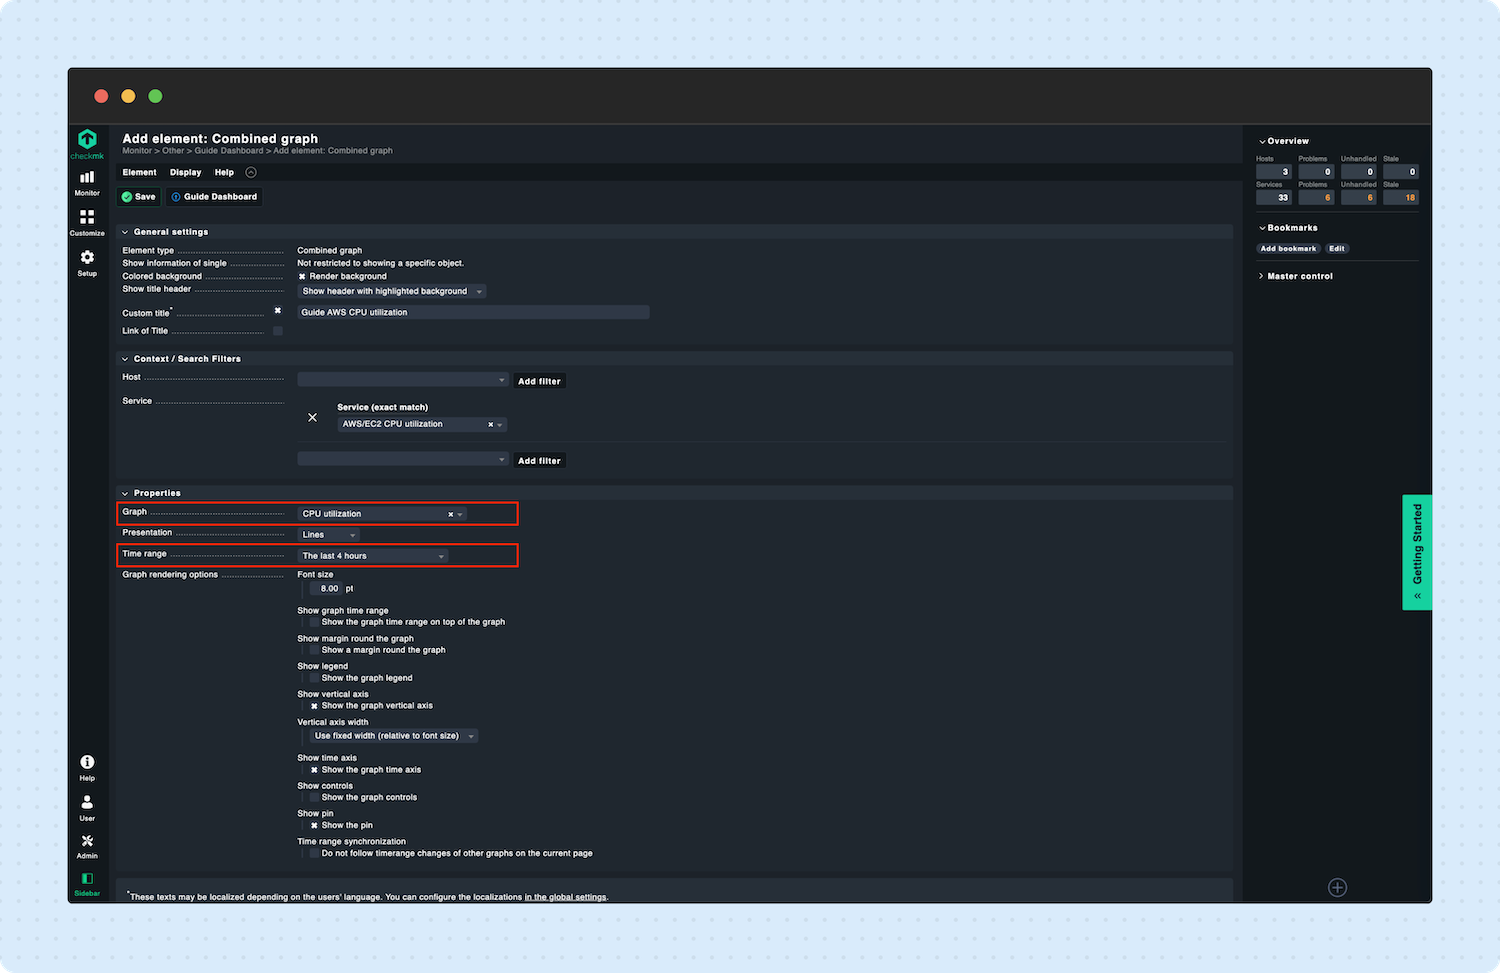
Select ‘CPU utilization’ as Graph and select a desired Time range.
Click Save.
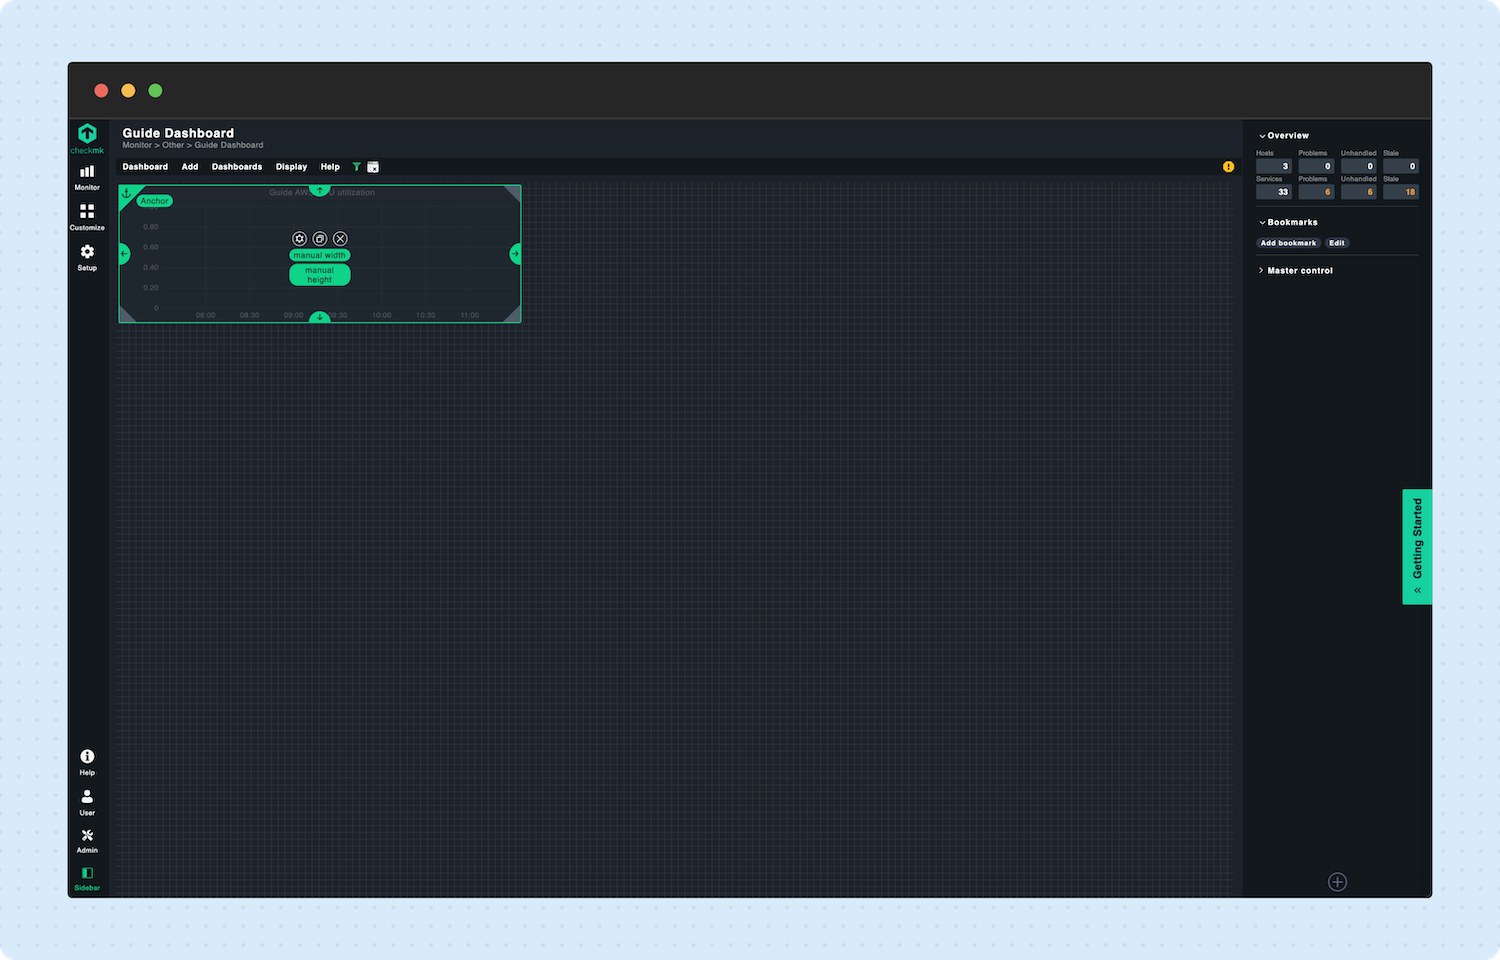
The Checkmk dashboard feature allows you to customize the size and layout of your dashboard fully.
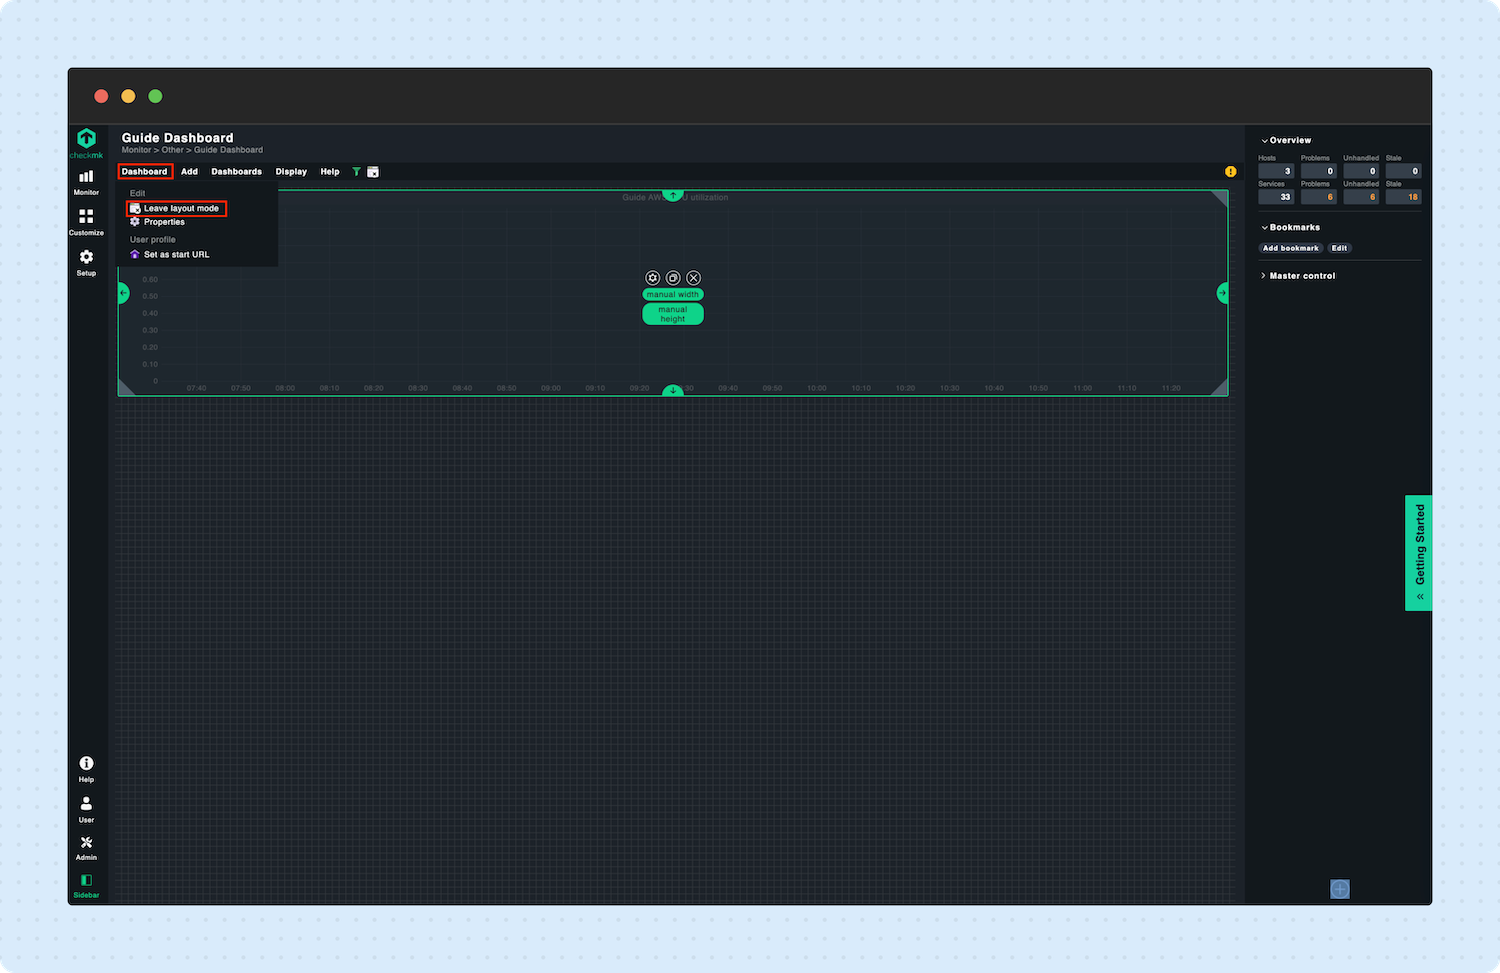
To finalize the setup, navigate to Dashboard -> Leave layout mode.
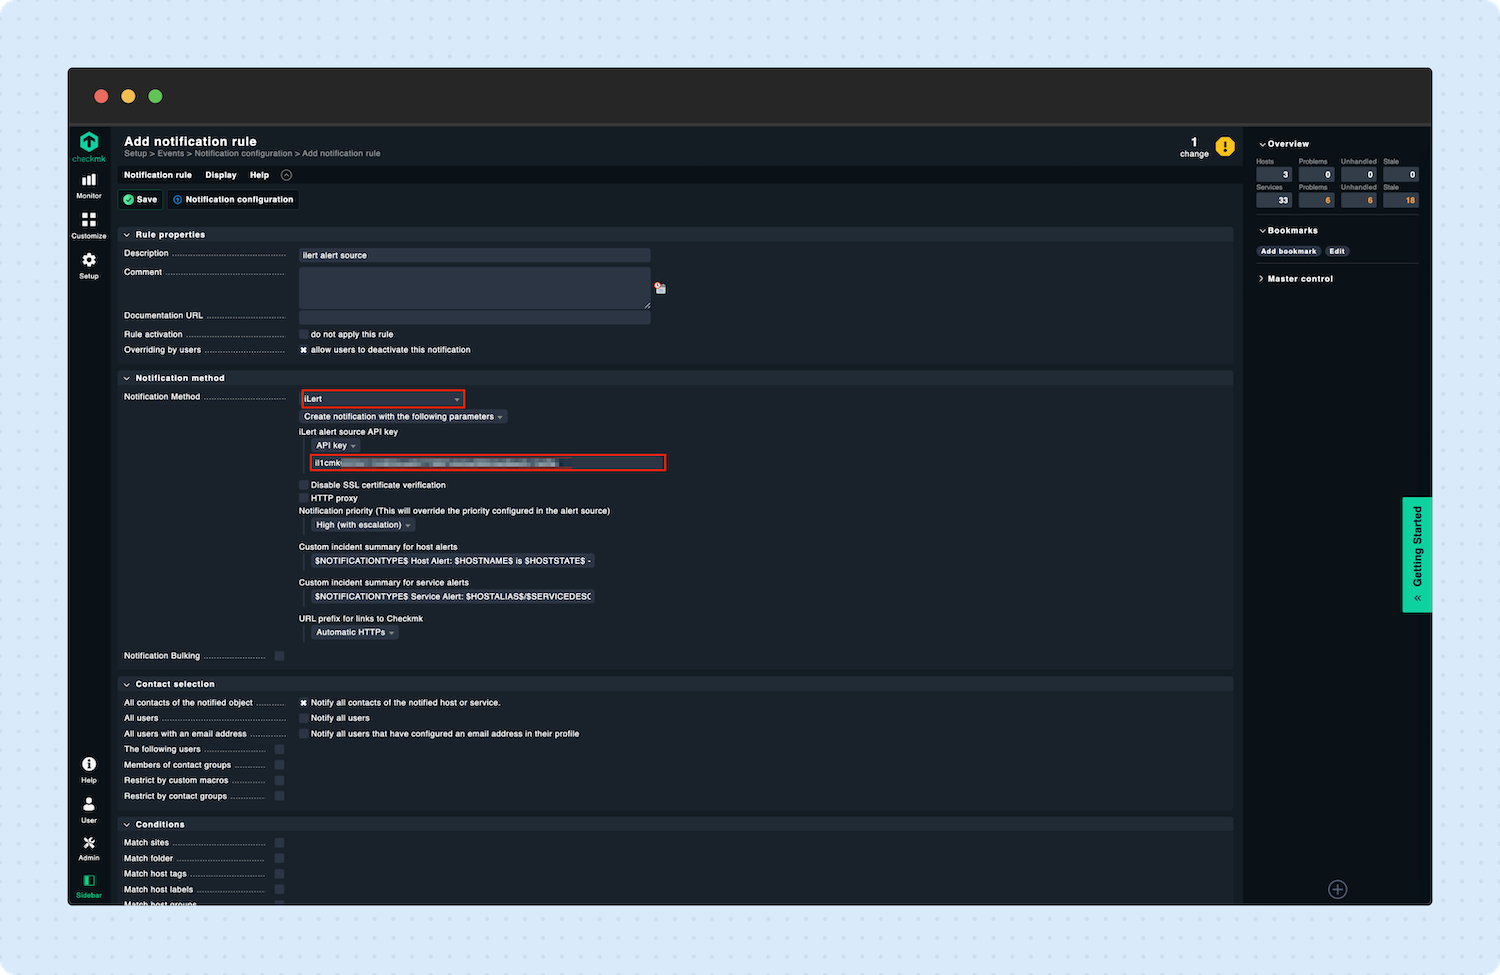
Stage 5: Connect Checkmk Cloud with ilert
To connect Checkmk Cloud with ilert, add a new Notification rule of type ‘ilert’ and enter the Integration key of your Checkmk alert source in ilert.


.png)

.png)

.png)


.png)